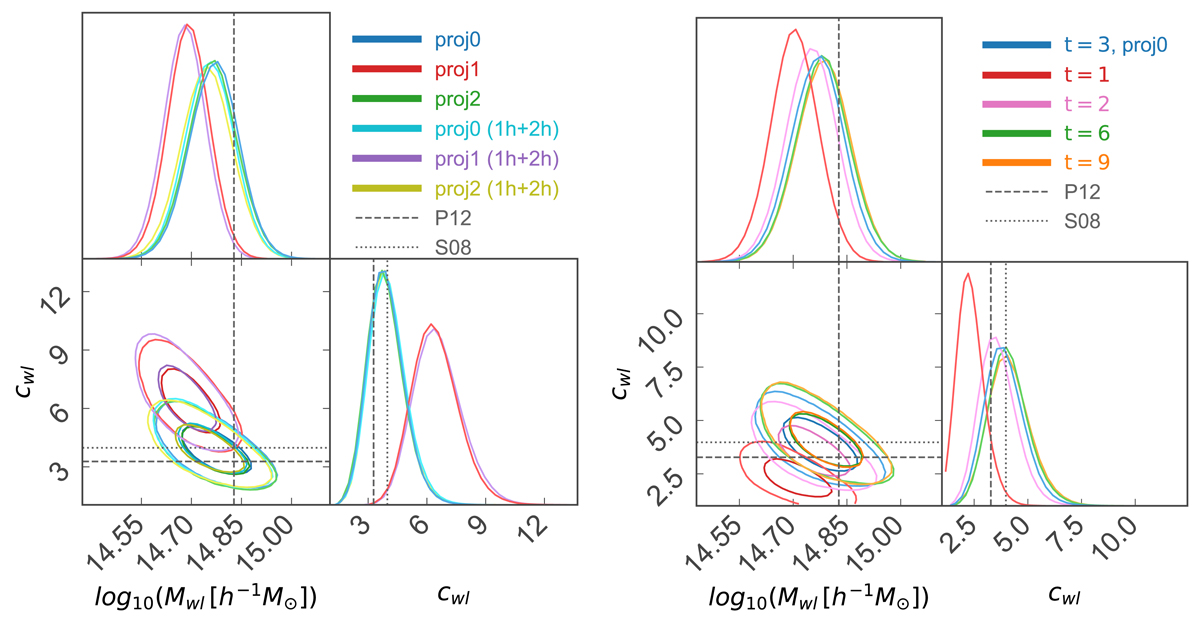
Fig. 5.
Download original image
Left panel: posterior distributions of the recovered logarithm of the mass Mwl and concentration cwl obtained by fitting the excess surface mass density profile of the three random projections of halo-4 at z = 0.22. Right panel: posterior distributions obtained by modelling the excess surface mass density profile of halo-4 when it is oriented along proj0, assuming different truncation radii. The blue data display the reference case with a truncation radius Rt = 3R200, and the red, pink, green, and orange data exhibit the results for Rt = t R200 with t = 1, 2, 6, and 9, respectively. The dark and light shaded areas enclose the 1 and 3σ credibility regions, respectively. In both panels, the vertical dashed line marks the true mass of the system, and the horizontal dotted and dashed lines indicate the concentrations computed using the Springel et al. (2008a) and Prada et al. (2012) formalisms, respectively.
Current usage metrics show cumulative count of Article Views (full-text article views including HTML views, PDF and ePub downloads, according to the available data) and Abstracts Views on Vision4Press platform.
Data correspond to usage on the plateform after 2015. The current usage metrics is available 48-96 hours after online publication and is updated daily on week days.
Initial download of the metrics may take a while.