Fig. 4.

Download original image
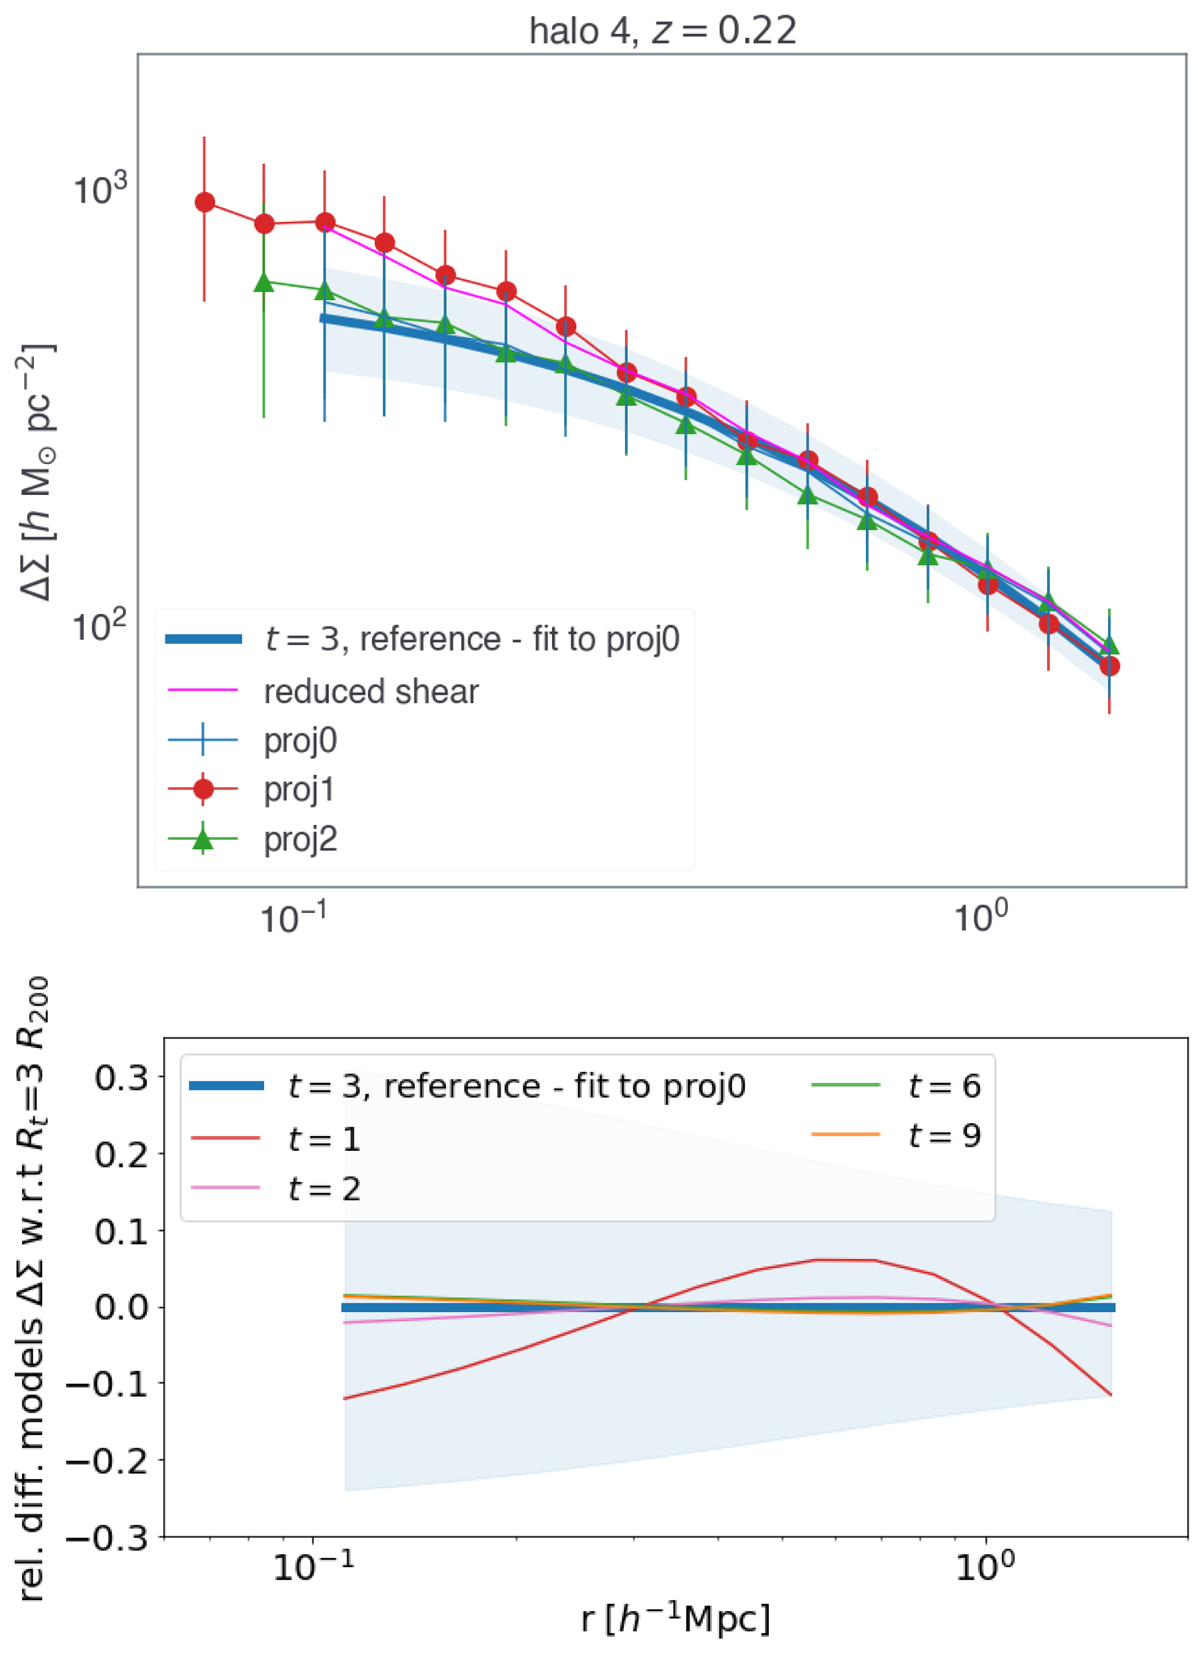
Top panel: excess surface mass density profiles of the three random projections for a cluster-size halo at zl = 0.22, as displayed in Fig. 3. The blue, red, and green data points show the circular averaged profiles of the halo projected along the z-, y-, and x-axis of the re-simulation box. The error bars on the data points account for both the dispersion of the intrinsic ellipticity of background galaxies and the error associated with the average measure in the considered radial bin. The solid blue line displays the best-fit model to proj0, and the shaded region represents the model with a confidence of 68%. Bottom panel: relative difference of the best-fit models assuming different values of the truncation radius Rt with respect to the reference case with t = 3.
Current usage metrics show cumulative count of Article Views (full-text article views including HTML views, PDF and ePub downloads, according to the available data) and Abstracts Views on Vision4Press platform.
Data correspond to usage on the plateform after 2015. The current usage metrics is available 48-96 hours after online publication and is updated daily on week days.
Initial download of the metrics may take a while.


