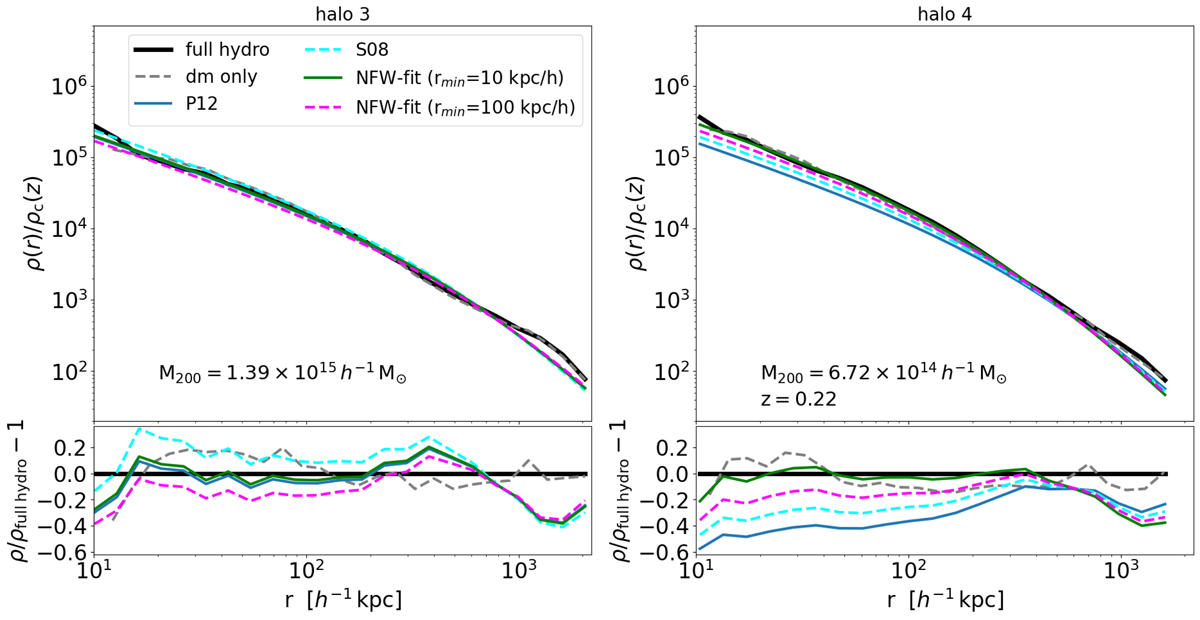
Fig. 2.
Download original image
Spherically averaged density profiles of halo 3 and halo 4. In each panel, the solid black curve displays the total matter density profile of the full hydrodynamical runs as considered in this work. For comparison, the dashed grey curve shows the profile of the dark matter-only runs. With solid blue and dashed cyan lines, we show the NFW profiles assuming concentrations as computed using the P12 and S08 formalisms, respectively. With solid green and dashed magenta lines, we show the NFW profiles with concentrations computed by fitting the logarithm profile outside 10 and 100 h−1 kpc, respectively. The profiles extend up to the halo virial radius R200, as computed by AHF.
Current usage metrics show cumulative count of Article Views (full-text article views including HTML views, PDF and ePub downloads, according to the available data) and Abstracts Views on Vision4Press platform.
Data correspond to usage on the plateform after 2015. The current usage metrics is available 48-96 hours after online publication and is updated daily on week days.
Initial download of the metrics may take a while.