Fig. 14.
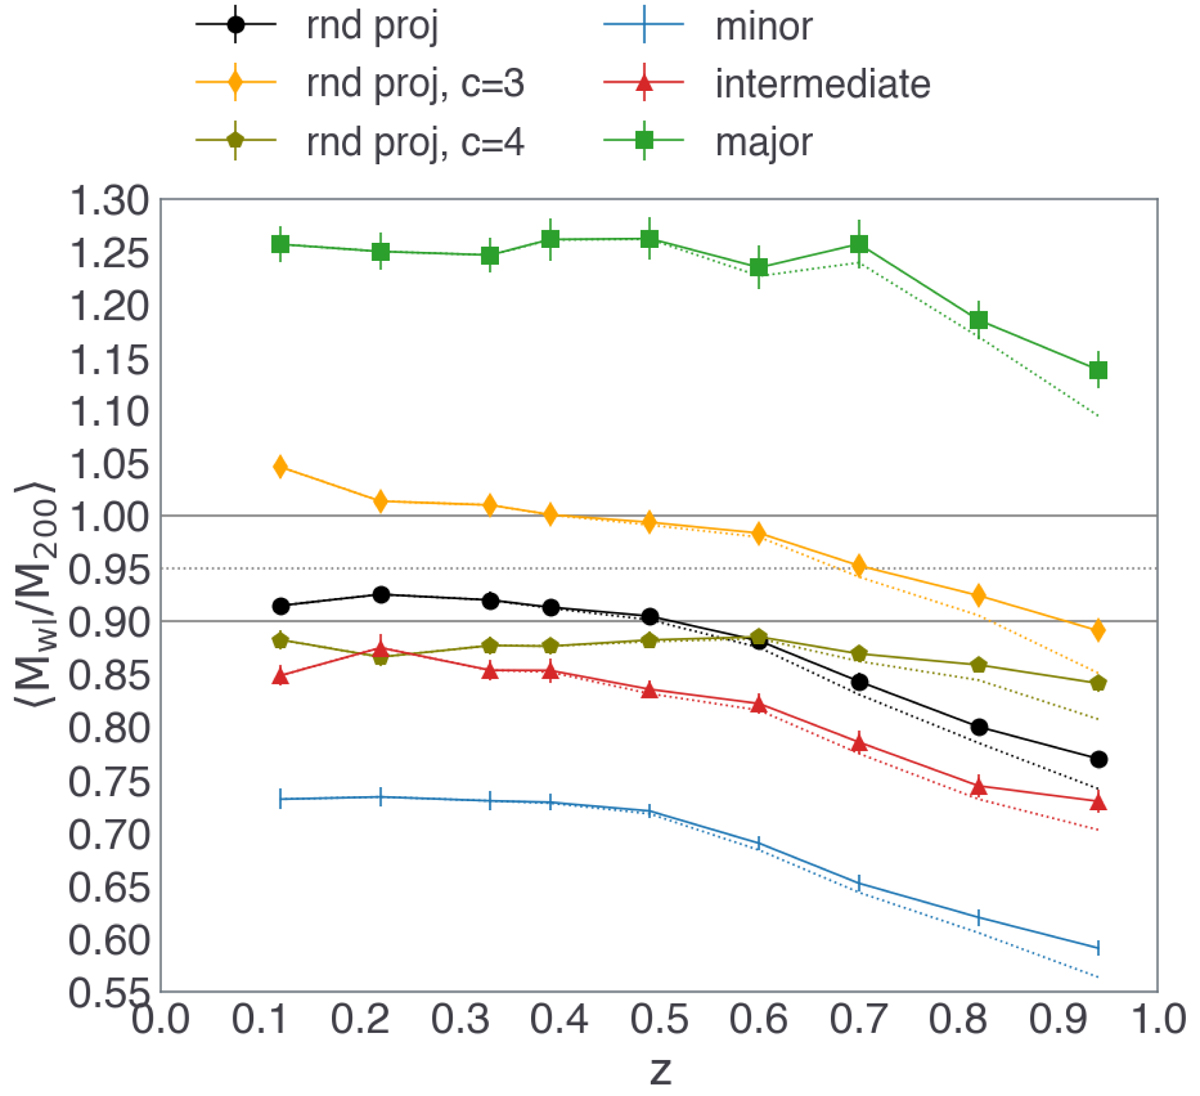
Download original image
Average cluster weak-lensing mass bias as a function of the lens redshift for clusters with M200 > 1014 M⊙. The various data points and colours refer to different ways of computing the cluster masses. The black circles display the case of random projections and modelling both the halo mass and concentration. The orange diamonds, and olive pentagons show the cases in which we assumed a fixed concentration parameter (three and four, respectively)and we fit only the halo mass. The light blue crosses, red triangles, and green squares show the average mass bias for the three particular projections along the minor, the intermediate, and the major axis, respectively. The dotted lines, which slightly deviated from the data points only at z > 0.6, correspond to the results for the whole cluster sample, with no minimum mass cut.
Current usage metrics show cumulative count of Article Views (full-text article views including HTML views, PDF and ePub downloads, according to the available data) and Abstracts Views on Vision4Press platform.
Data correspond to usage on the plateform after 2015. The current usage metrics is available 48-96 hours after online publication and is updated daily on week days.
Initial download of the metrics may take a while.