Fig. 10.
Download original image
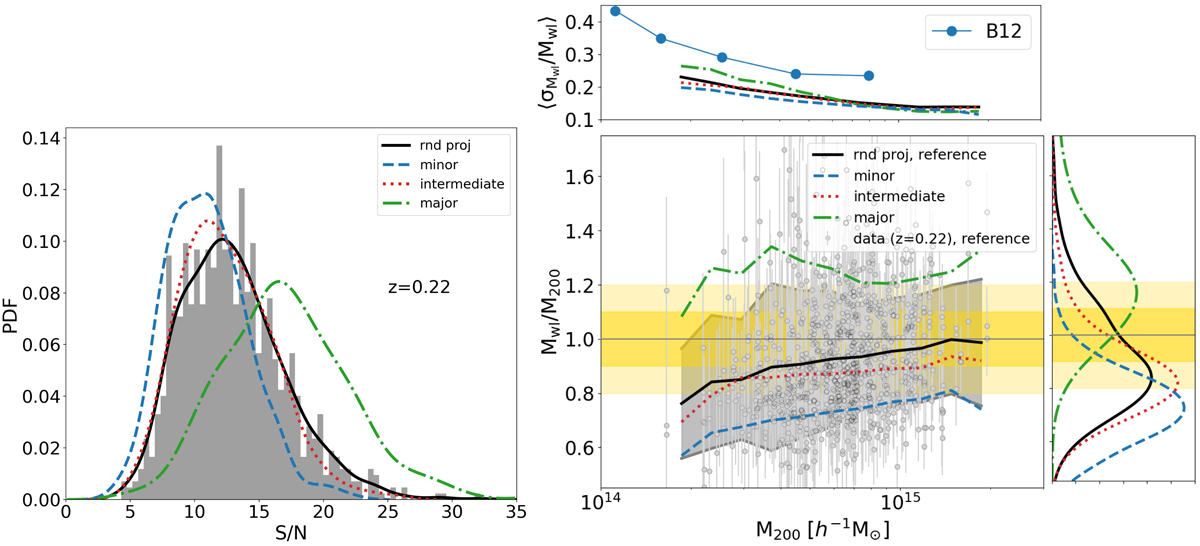
Left panel: weak-lensing signal-to-noise ratio distributions for the sample of clusters at z = 0.22. The shaded grey histogram shows the distribution for the clusters oriented along random projections, namely the x, y, and z Cartesian axes of the re-stimulated box region. The solid black curve represents the KDE of the grey discrete histogram. The blue (dashed), red (dotted), and green (dot-dashed) curves refer to the KDE of the distributions when systems are oriented along the minor, intermediate, and major axis of the cluster ellipsoid, respectively. Right panel: weak-lensing derived mass bias as a function of the true mass of the cluster. The solid blue (dashed), red (dotted), and green (dot-dashed) lines display the moving average of the corresponding mass bias data points of the preferential projections, minor, intermediate, and major axis, respectively. The top and right sub-panels display the relative mass uncertainties as a function of the true mass and the weak-lensing mass bias distributions, respectively.
Current usage metrics show cumulative count of Article Views (full-text article views including HTML views, PDF and ePub downloads, according to the available data) and Abstracts Views on Vision4Press platform.
Data correspond to usage on the plateform after 2015. The current usage metrics is available 48-96 hours after online publication and is updated daily on week days.
Initial download of the metrics may take a while.