Fig. C.1.
Download original image
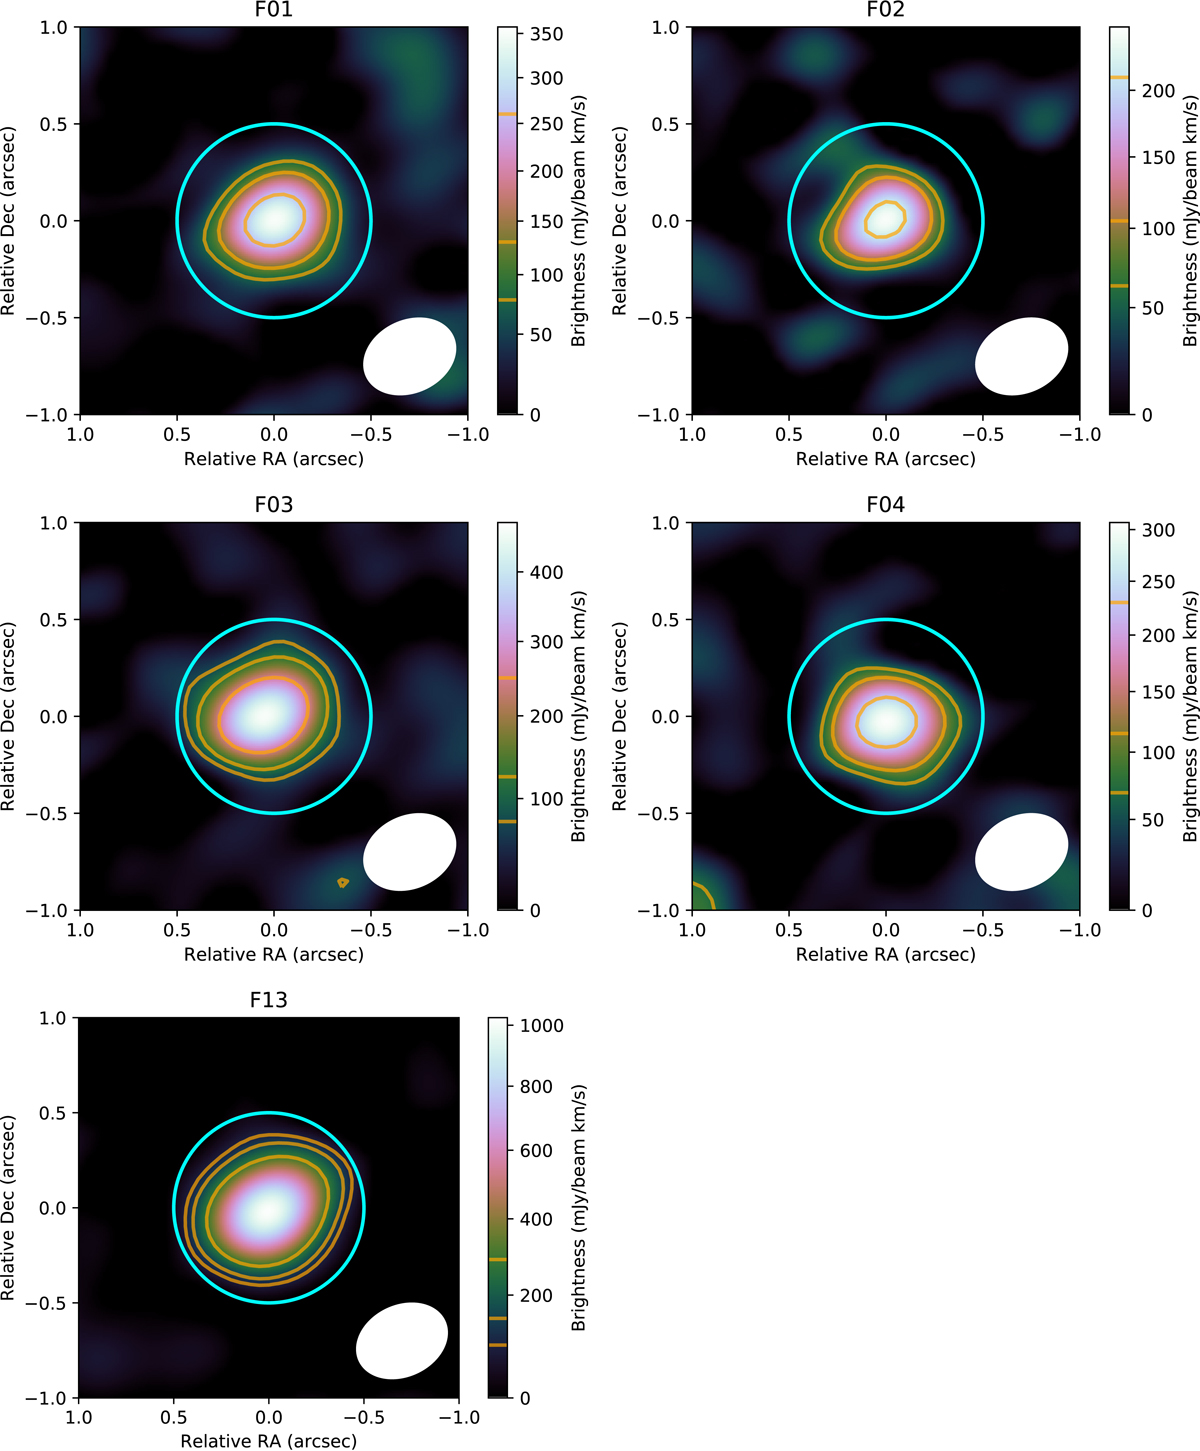
ALMA band 6 CO v = 0 J = 2-1 zeroth moment maps of five red supergiants in RSGC1: F01 (upper left), F02 (upper right), F03 (middle left), F04 (middle right), and F13 (bottom left). The ordinate and co-ordinate axis give the offset of the right ascension and declination, respectively, with respect to the input coordinates for the ALMA observations (see columns 2 and 3 in Table A.1). The ALMA synthesised beam is shown as a white ellipse in the lower right corner of each panel. The contours (in orange) show the CO emission at [3, 5, 10] times the rms value. The cyan circle has a diameter of size 1″ and is centred on the peak of the continuum emission.
Current usage metrics show cumulative count of Article Views (full-text article views including HTML views, PDF and ePub downloads, according to the available data) and Abstracts Views on Vision4Press platform.
Data correspond to usage on the plateform after 2015. The current usage metrics is available 48-96 hours after online publication and is updated daily on week days.
Initial download of the metrics may take a while.