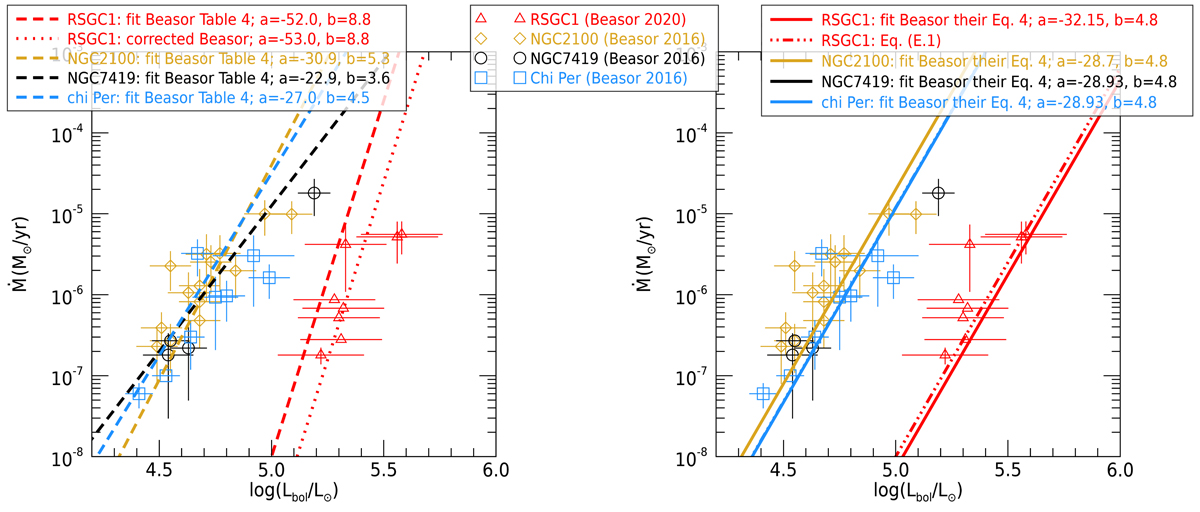
Fig. E.1.
Download original image
Ṁ-luminosity relations as determined by Beasor et al. (2020). The coloured symbols represent the (Lbol, ṀSED)-values for four open clusters as derived by Beasor & Davies (2016), Beasor et al. (2020); error bars indicate their most conservative error estimates. The straight lines in both panels show the individual straight-line fits to each relation log(ṀSED/M⊙ yr−1) = a + b log(Lbol/L⊙) for all clusters in the sample. In the left panel, the dashed lines show the Ṁ-Lbol relation using the values for the offset and slope as given in Table 4 of Beasor et al. (2020); the full lines in the right panel show the fits to the Ṁ-Lbol relation once the gradient is fixed to b = 4.8, following Eq. 4 of Beasor et al. (2020) and using the values for the initial mass as given in Table 1 of Beasor et al. (2020). The red dotted line in the left panel shows the fit to RSGC1 for an intercept a = -53; see footnote 7. The red dashed-triple dotted lin in the right panel shows the fit to RSGC1 following Eq. (E.1).
Current usage metrics show cumulative count of Article Views (full-text article views including HTML views, PDF and ePub downloads, according to the available data) and Abstracts Views on Vision4Press platform.
Data correspond to usage on the plateform after 2015. The current usage metrics is available 48-96 hours after online publication and is updated daily on week days.
Initial download of the metrics may take a while.