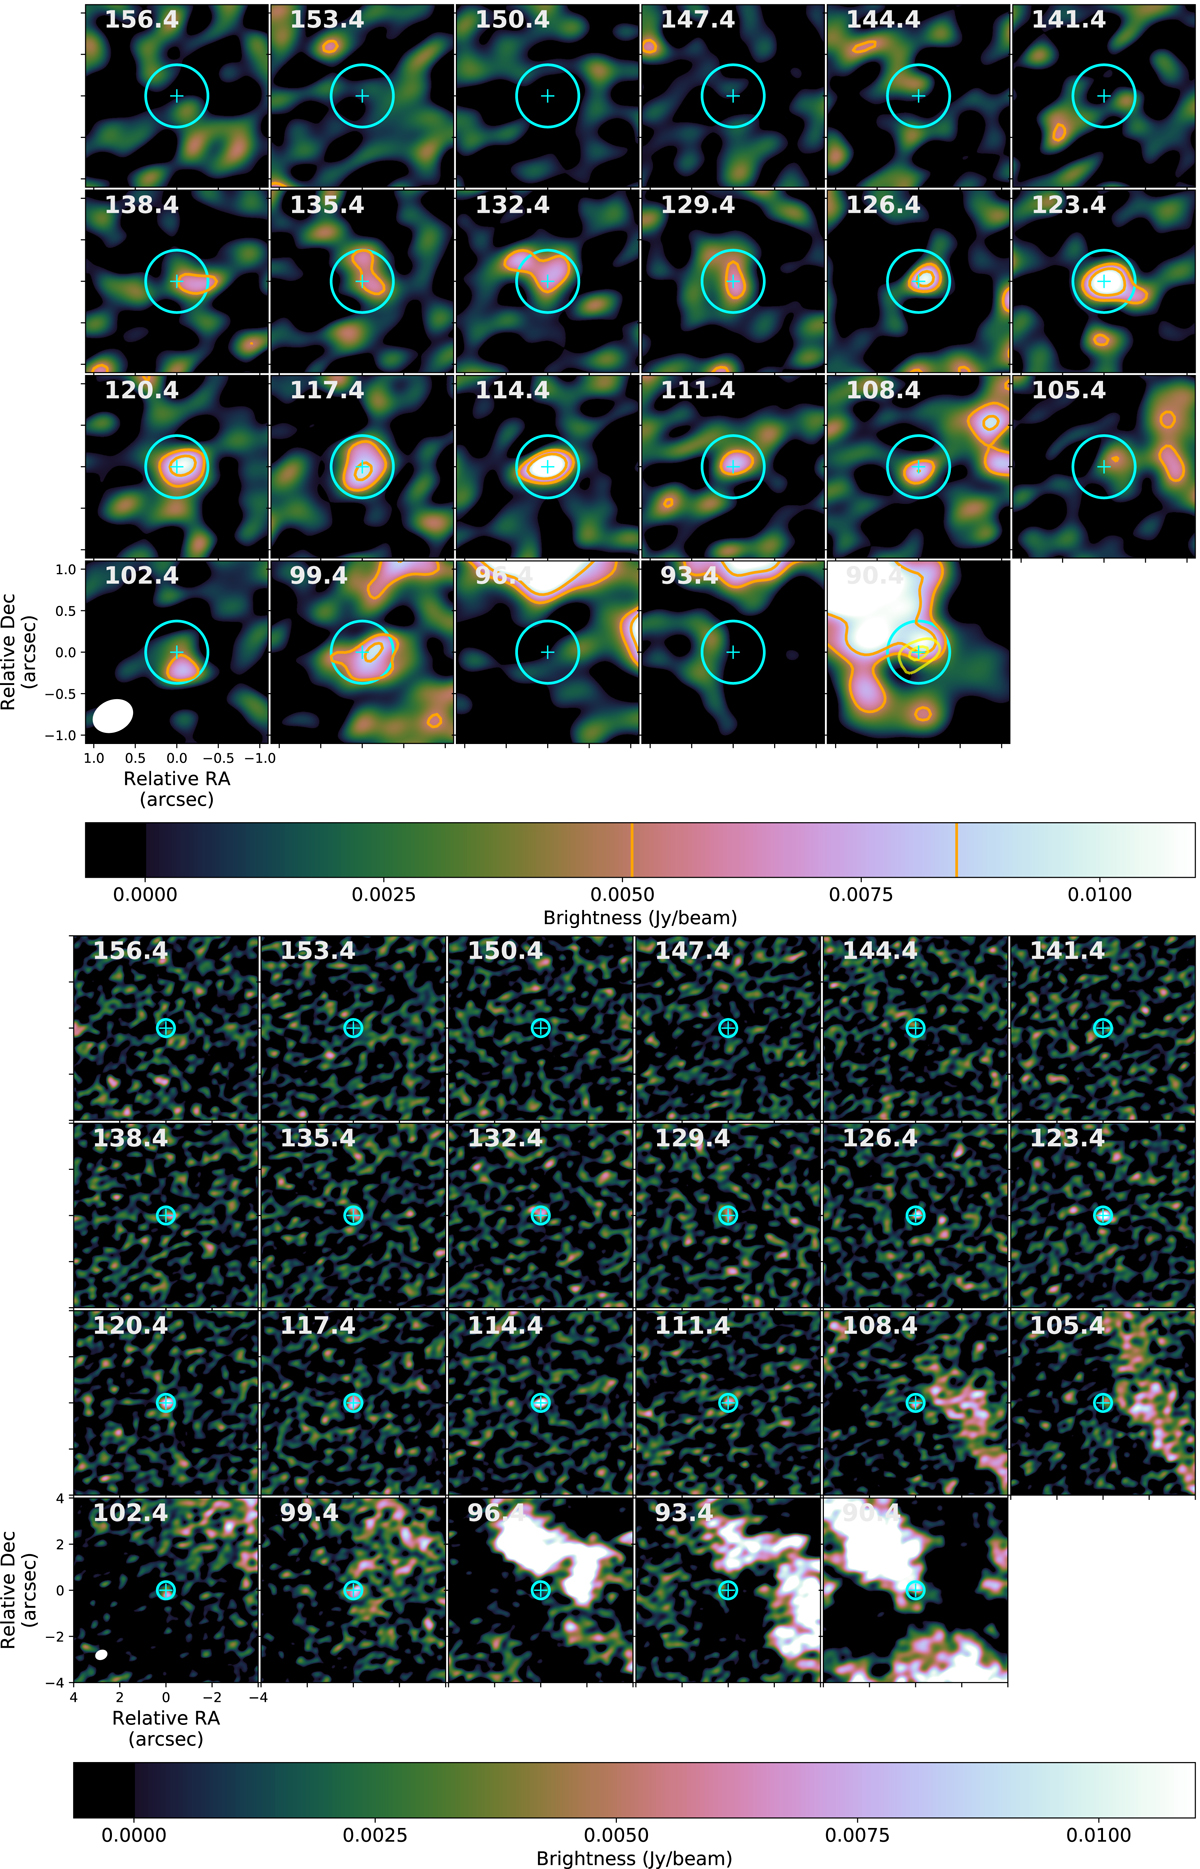
Fig. C.3.
Download original image
12CO v = 0 J = 2-1 channel map of F01. The ordinate and co-ordinate axis give the offset of the right ascension and declination, respectively, with respect to the peak of the continuum emission (indicated by the cyan cross in the upper panels). The velocity is given in the upper left corner of each panel (in units of km s−1). The cyan circle indicates the circular aperture of 0![]() 75 (diameter) centred on the peak of the continuum emission that was used for extracting the CO(2-1) line profile. The ALMA beam is shown as a white ellipse in the bottom left corner of the bottom left panel. Upper plot: The contours (in orange) show the CO emission at [3, 5]×σrms (see Table A.1). The contours (in yellow) in the last panel show the continuum emission at [60, 90, and 99]% of the peak continuum emission.
75 (diameter) centred on the peak of the continuum emission that was used for extracting the CO(2-1) line profile. The ALMA beam is shown as a white ellipse in the bottom left corner of the bottom left panel. Upper plot: The contours (in orange) show the CO emission at [3, 5]×σrms (see Table A.1). The contours (in yellow) in the last panel show the continuum emission at [60, 90, and 99]% of the peak continuum emission.
Current usage metrics show cumulative count of Article Views (full-text article views including HTML views, PDF and ePub downloads, according to the available data) and Abstracts Views on Vision4Press platform.
Data correspond to usage on the plateform after 2015. The current usage metrics is available 48-96 hours after online publication and is updated daily on week days.
Initial download of the metrics may take a while.