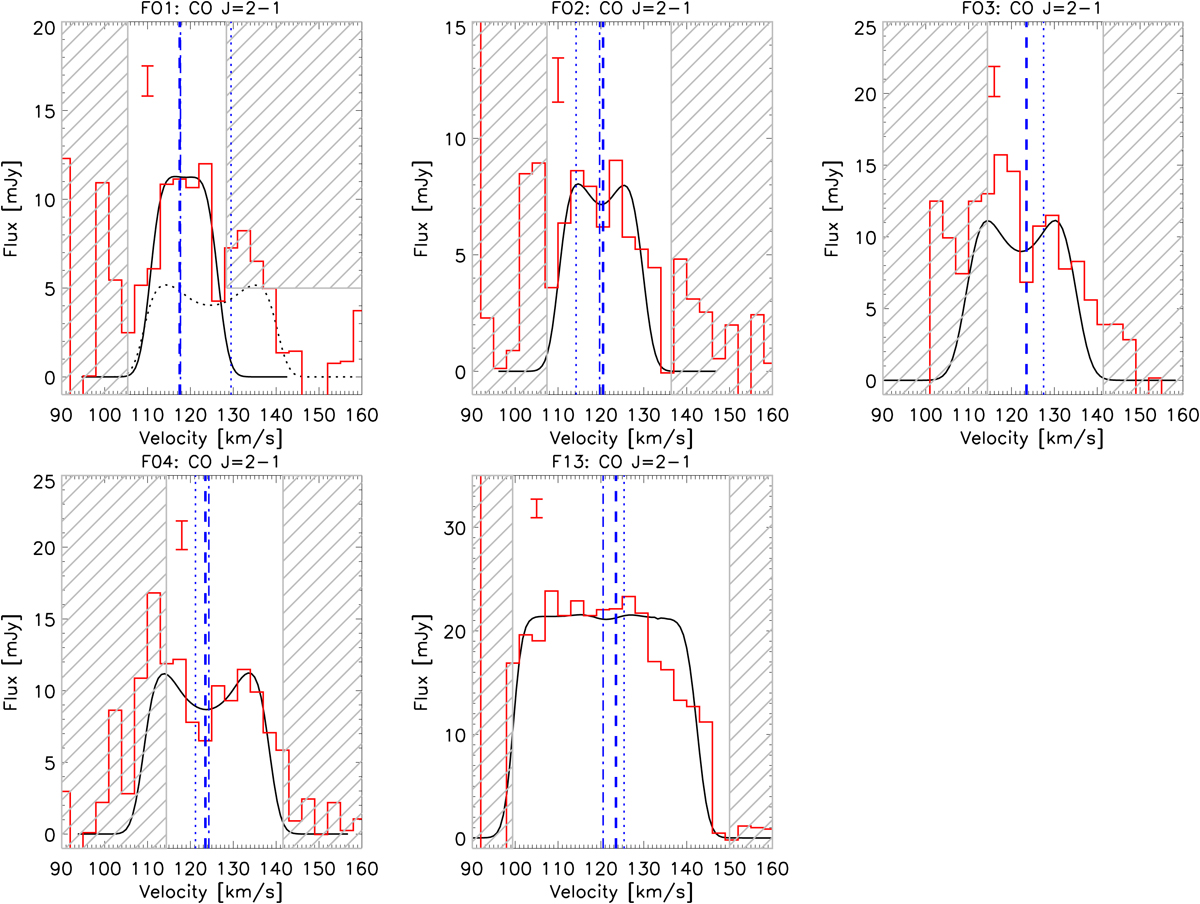
Fig. 1.
Download original image
CO(2–1) line profiles of 5 red supergiants in RSGC1. The ALMA data are plotted as red histograms. Synthetic line profiles (see Sect. 3) are overplotted as black solid lines. The grey dashed regions indicate frequency regions that are contaminated by the ISM, a strong noise background, or other genuine emission (see Appendix A). The vertical dashed blue lines indicate the local standard of rest velocity, vLSR, as deduced from the ALMA CO data (see Appendix A). The dotted and dashed-dotted blue lines indicate the vLSR value as determined by Davies et al. (2008) and Nakashima & Deguchi (2006), respectively (see Table A.1). The noise in the spectrum is 1.2–1.4 mJy (see text for derivation) and is shown as (red) error bar in each panel. The dotted black line in the upper left panel is an alternative fit to the CO(2–1) line profile of F01, as discussed in Appendix C.
Current usage metrics show cumulative count of Article Views (full-text article views including HTML views, PDF and ePub downloads, according to the available data) and Abstracts Views on Vision4Press platform.
Data correspond to usage on the plateform after 2015. The current usage metrics is available 48-96 hours after online publication and is updated daily on week days.
Initial download of the metrics may take a while.