Fig. C.1.
Download original image
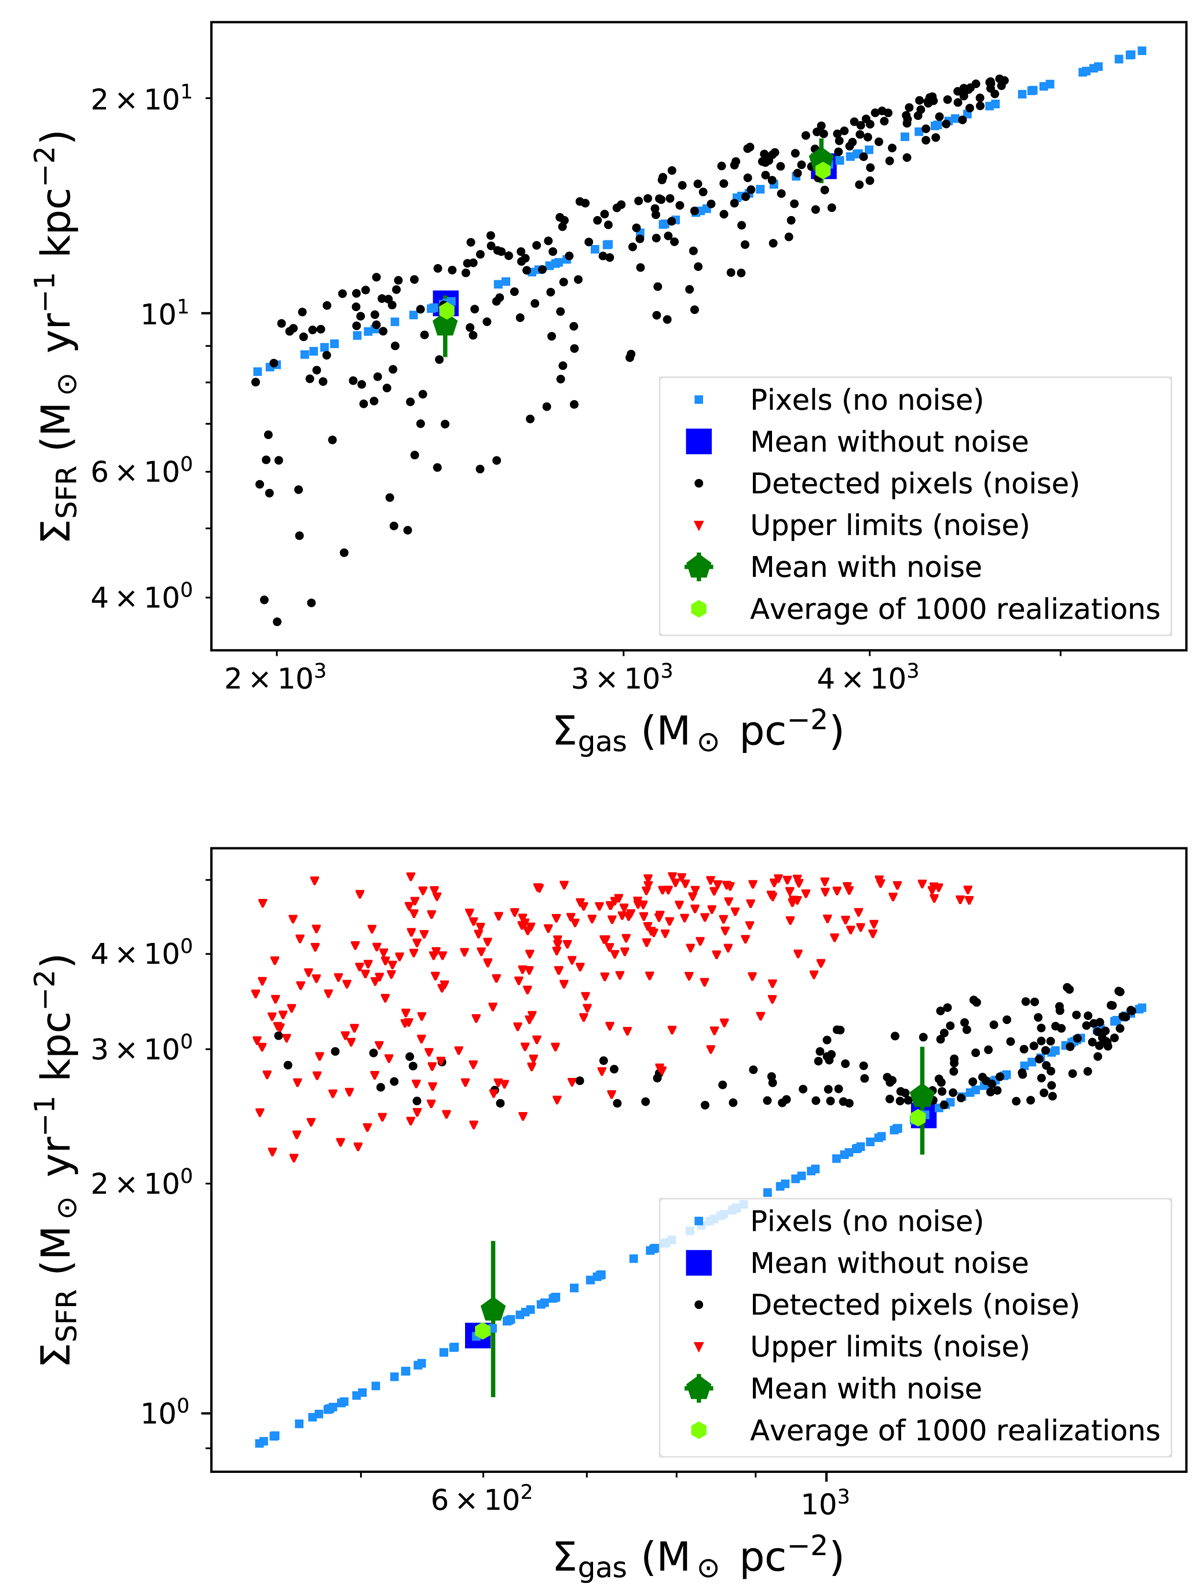
Kennicutt-Schmidt relation between the SFR and gas surface density in our simulation described in Appendix C. The panels correspond to two different simulated objects based on DC873756 (upper panel) and VC5110377875 (lower panel), illustrating different S/N regimes. The small blue squares show the pixels of the noiseless map, and the large dark blue squares are the mean computed in the low and high gas density regions (see Sect. 3). The small black filled circles are the 5σ SFR detections in the noisy maps, and the small red downward-facing triangles are the 3σ upper limits of non-detections. The dark green filled pentagons are the mean values measures in the two gas density regions. The small light green hexagons are the averages of these mean measurements over 1000 noise realizations.
Current usage metrics show cumulative count of Article Views (full-text article views including HTML views, PDF and ePub downloads, according to the available data) and Abstracts Views on Vision4Press platform.
Data correspond to usage on the plateform after 2015. The current usage metrics is available 48-96 hours after online publication and is updated daily on week days.
Initial download of the metrics may take a while.