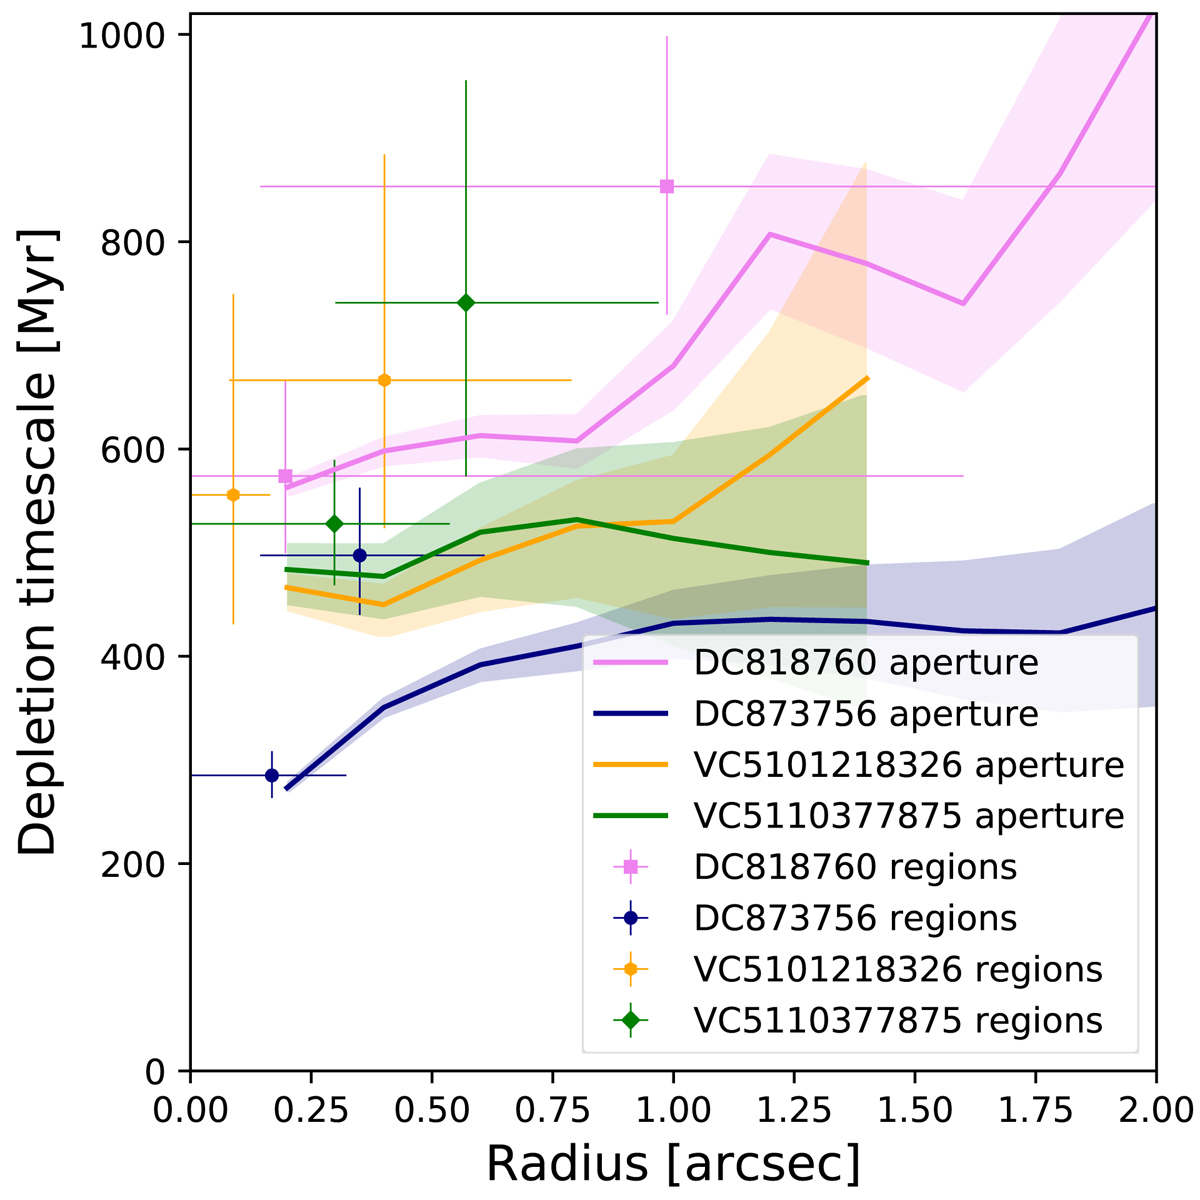
Fig. B.1.
Download original image
Gas depletion timescale measured in an aperture centered on the maximum of the [CII] emission as a function of its radius (solid lines, see Appendix B). The colored areas correspond to the 1σ uncertainties determined using the Monte Carlo sampling described in Sect. 3. For comparison, we represent the depletion timescales measured in our two Σgas regions using the same symbols as in Fig. 3. The horizontal error bars correspond to the full range of angular radial distances to the [CII] maximum in the region. The high-density region systematically corresponds to the smaller radius.
Current usage metrics show cumulative count of Article Views (full-text article views including HTML views, PDF and ePub downloads, according to the available data) and Abstracts Views on Vision4Press platform.
Data correspond to usage on the plateform after 2015. The current usage metrics is available 48-96 hours after online publication and is updated daily on week days.
Initial download of the metrics may take a while.