Fig. 3.
Download original image
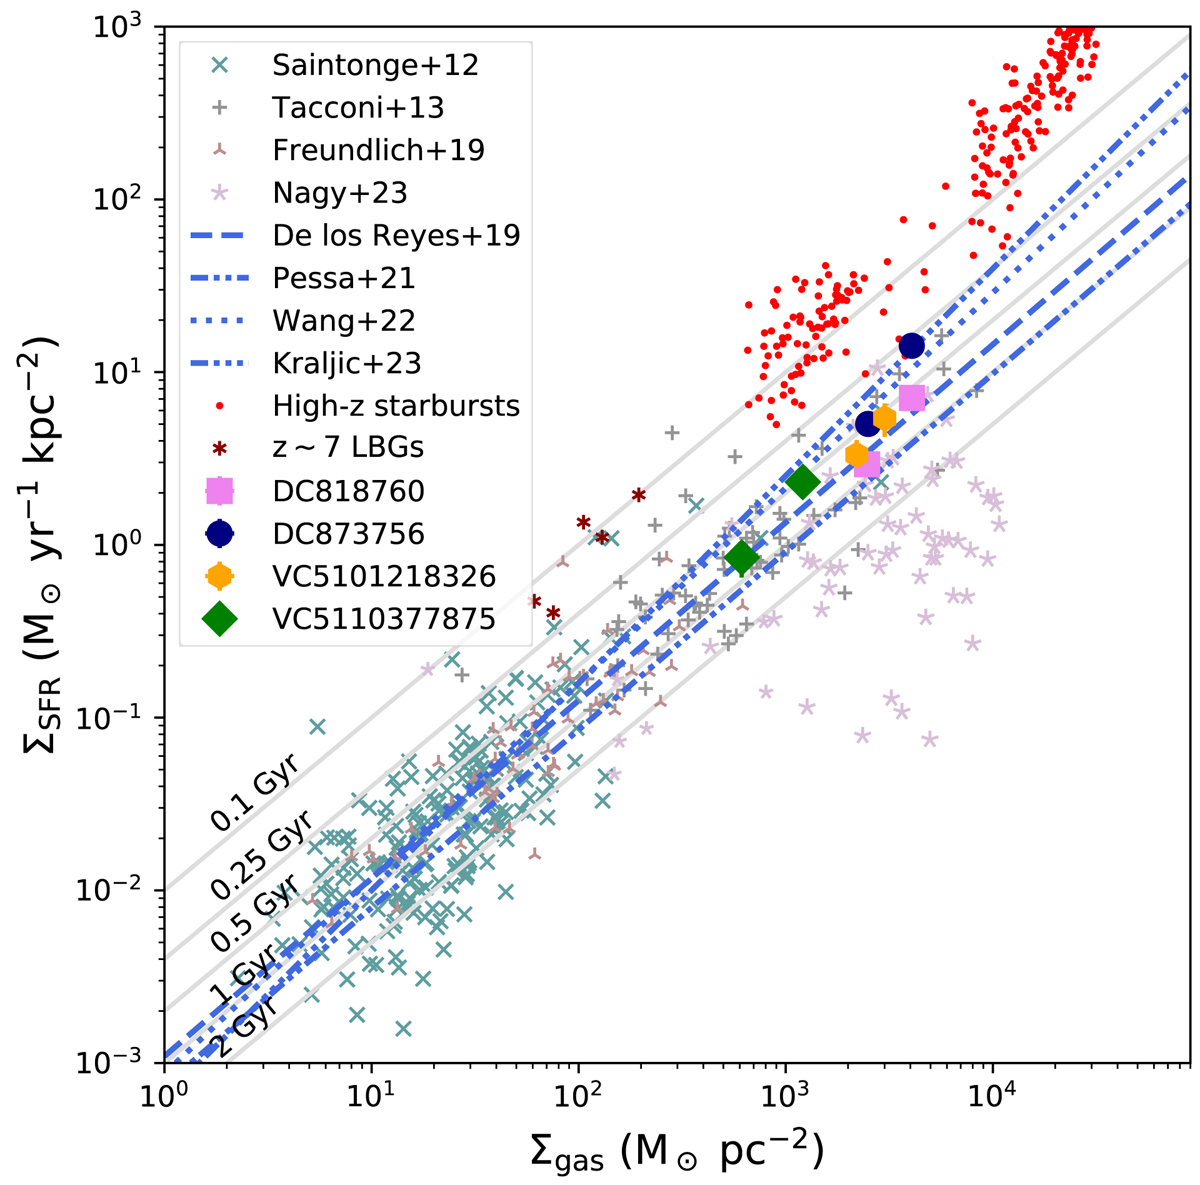
Kennicutt-Schmidt relation between the SFR and gas surface density. The averaged data points from DC818760, DC873756, VC5101218326, and VC5110377875 are shown as violet squares, blue filled circles, yellow hexagons, and green diamonds, respectively. Our results are compared with the CO measurements of the global KS relation from the low-z COLD GASS sample (Saintonge et al. 2012, crosses) and at redshifts up to z ∼ 2.5 from the PHIBBS (Tacconi et al. 2013, plus signs) and PHIBBS2 (Freundlich et al. 2019, three-branch stars) programs, together with the resolved KS relation in z ∼ 1 lensed main-sequence galaxies (Nagy et al. 2023, five-branch stars). Also shown are the global (de los Reyes & Kennicutt 2019, dashed line) and resolved (Pessa et al. 2021, two-dot-dashed line) KS relations measured in the local Universe, the high-redshift global KS relation obtained by ALMA CO stacking (Wang et al. 2022, dotted line), and the global KS relation from simulations at z ∼ 4 (Kraljic et al. 2023, three-dot-dashed line). The thin gray lines indicate the various depletion timescales. The red points are resolved measurements in high-z starbursts by Hodge et al. (2015). The brown six-branch stars are the measurements in z ∼ 7 LBGs by Vallini et al. (2024). The error bars include only the uncertainties from the instrumental noise, but not from the calibration (∼10 % for ALMA) or from the conversion factors used in Sect. 2. They are often smaller than the symbols.
Current usage metrics show cumulative count of Article Views (full-text article views including HTML views, PDF and ePub downloads, according to the available data) and Abstracts Views on Vision4Press platform.
Data correspond to usage on the plateform after 2015. The current usage metrics is available 48-96 hours after online publication and is updated daily on week days.
Initial download of the metrics may take a while.