Fig. 4.
Download original image
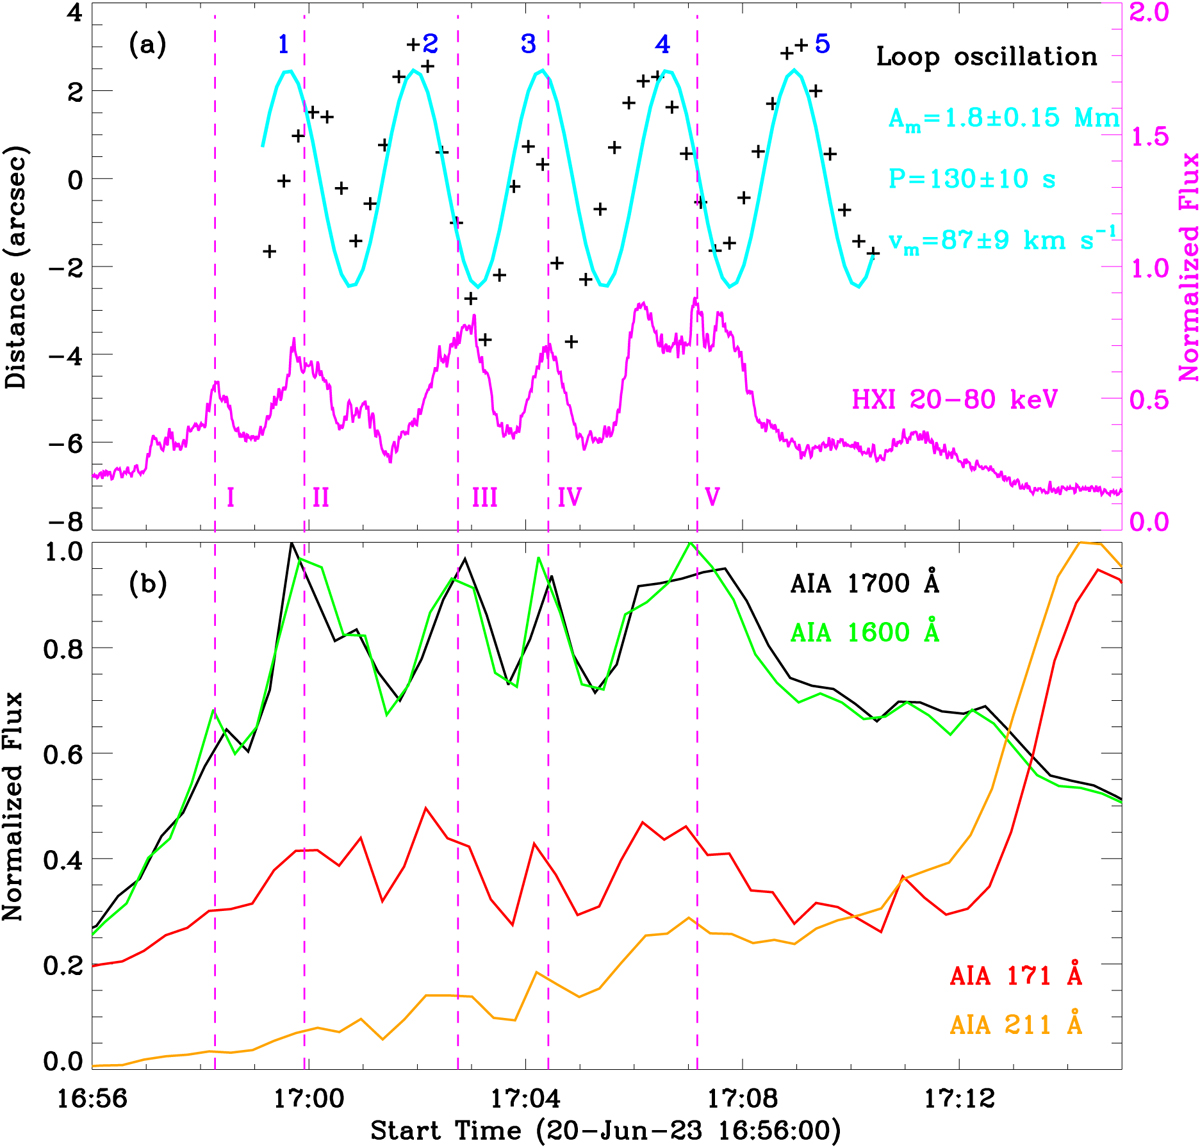
Oscillating positions (‘+’) after removing the background trend and its best-fitting result, shown in cyan (a). They are taken from the coronal loop at AIA 171 Å, as shown in Fig. 3. The magenta curve shows the HXR flux measured by ASO-S/HXI at 20–80 keV during 16:56–17:15 UT. Local light curve integrated over the flare region (indicated by the gold box in Fig. 2) in psaabands of AIA 1700 Å (black), 1600 Å (green), 171 Å (red), and 211 Å (orange), respectively (b). The Arabic and English numbers, as well as the dashed vertical lines outline these oscillating peaks.
Current usage metrics show cumulative count of Article Views (full-text article views including HTML views, PDF and ePub downloads, according to the available data) and Abstracts Views on Vision4Press platform.
Data correspond to usage on the plateform after 2015. The current usage metrics is available 48-96 hours after online publication and is updated daily on week days.
Initial download of the metrics may take a while.