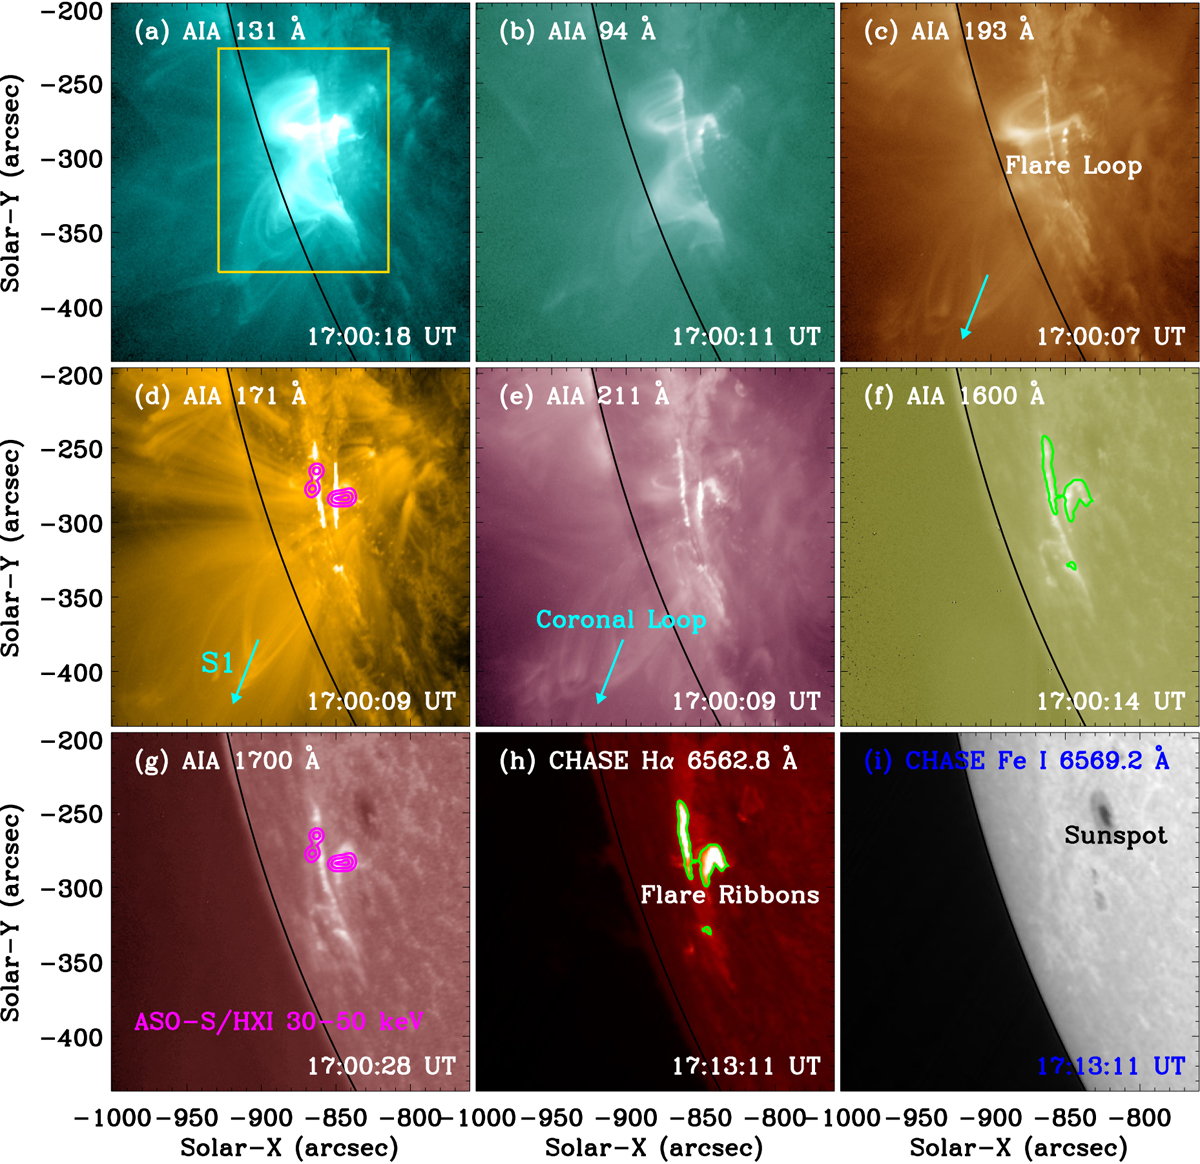
Fig. 2.
Download original image
Multi-wavelength snapshots with a FOV of ∼240″ × 240″ measured by SDO/AIA at 131 Å (a), 94 Å (b), 193 Å (c), 171 Å (d), 211 Å (e), 1600 Å (f), and 1700 Å (g), and captured by CHASE in passbands of Hα 6562.8 Å (h) and Fe I 6569.2 Å (i), respectively. The gold box outlines the flare region used to integrate the local flare flux. The cyan arrow indicates the targeted coronal loop, which is used to generate the time-distance map. The magenta contours represents the HXR emission at HXI 30–50 keV, and the contour levels are set 30%, 60%, and 90%. The green contours are derived from the Hα radiation measured by CHASE. An animation that shows the evolution of the solar flare and coronal loop is available online.
Current usage metrics show cumulative count of Article Views (full-text article views including HTML views, PDF and ePub downloads, according to the available data) and Abstracts Views on Vision4Press platform.
Data correspond to usage on the plateform after 2015. The current usage metrics is available 48-96 hours after online publication and is updated daily on week days.
Initial download of the metrics may take a while.