Fig. 1.
Download original image
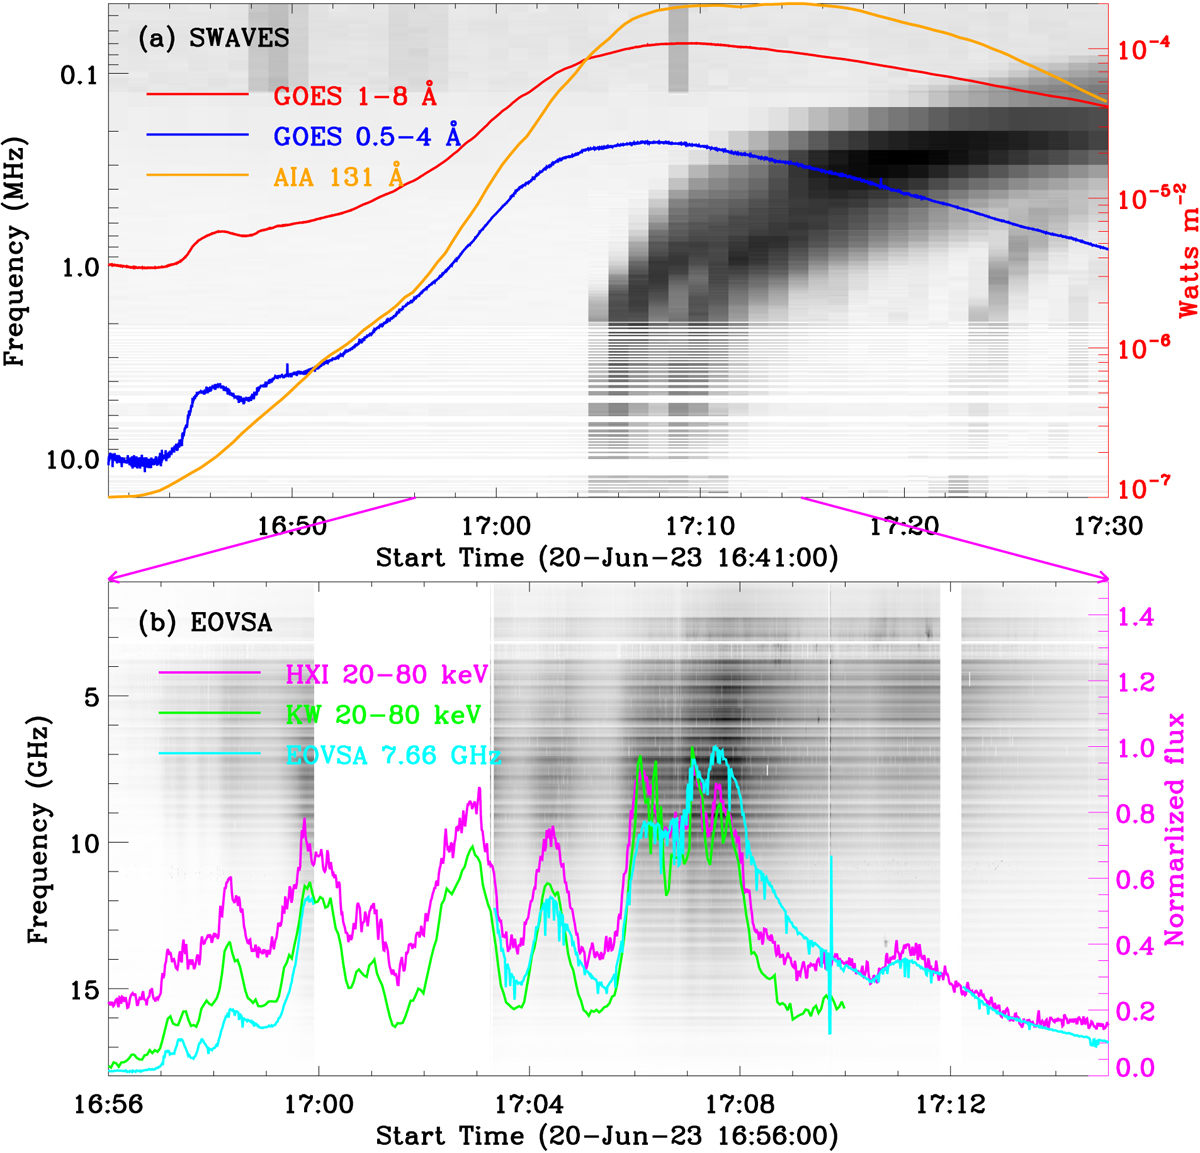
Overview of the solar flare on 2023 June 20. a: full-disk light curves from 16:41 UT to 17:30 UT recorded by GOES at 1–8 Å (red) and 0.5–4 Å (blue), and the local light curve integrated over the flare region measured by SDO/AIA at 131 Å. b: full-disk light curves between 16:56 UT and 17:15 UT in passbands of HXI 20–80 keV (magenta), KW 20–80 keV (green), and EOVSA 7.66 GHz (cyan). The context images are radio dynamic spectra observed by SWAVES (a) and EOVSA (b), respectively.
Current usage metrics show cumulative count of Article Views (full-text article views including HTML views, PDF and ePub downloads, according to the available data) and Abstracts Views on Vision4Press platform.
Data correspond to usage on the plateform after 2015. The current usage metrics is available 48-96 hours after online publication and is updated daily on week days.
Initial download of the metrics may take a while.