Open Access
Fig. 7.
Download original image
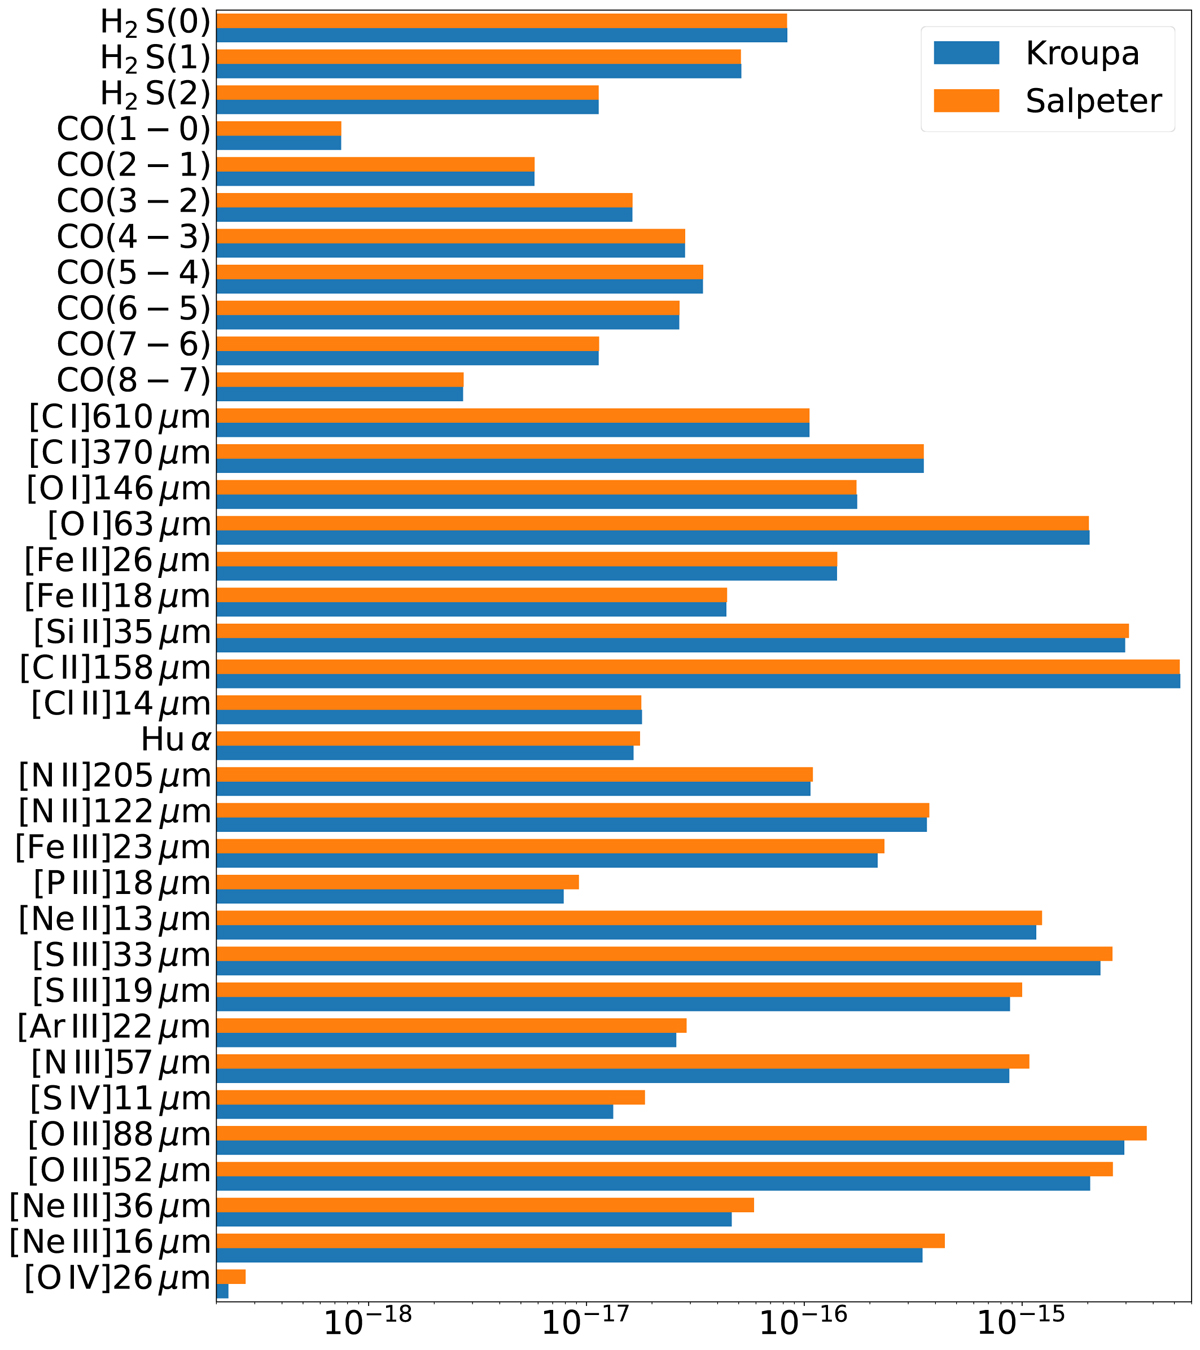
Comparison of predicted line fluxes from Cloudy runs, using a Kroupa (blue) and Salpeter (orange) IMF input spectrum, respectively. For representation reasons, the [Ne V] emission lines are not shown but are both of the order of 10−28 W m−2, i.e. within the upper limits of our observations.
Current usage metrics show cumulative count of Article Views (full-text article views including HTML views, PDF and ePub downloads, according to the available data) and Abstracts Views on Vision4Press platform.
Data correspond to usage on the plateform after 2015. The current usage metrics is available 48-96 hours after online publication and is updated daily on week days.
Initial download of the metrics may take a while.