Fig. 9.
Download original image
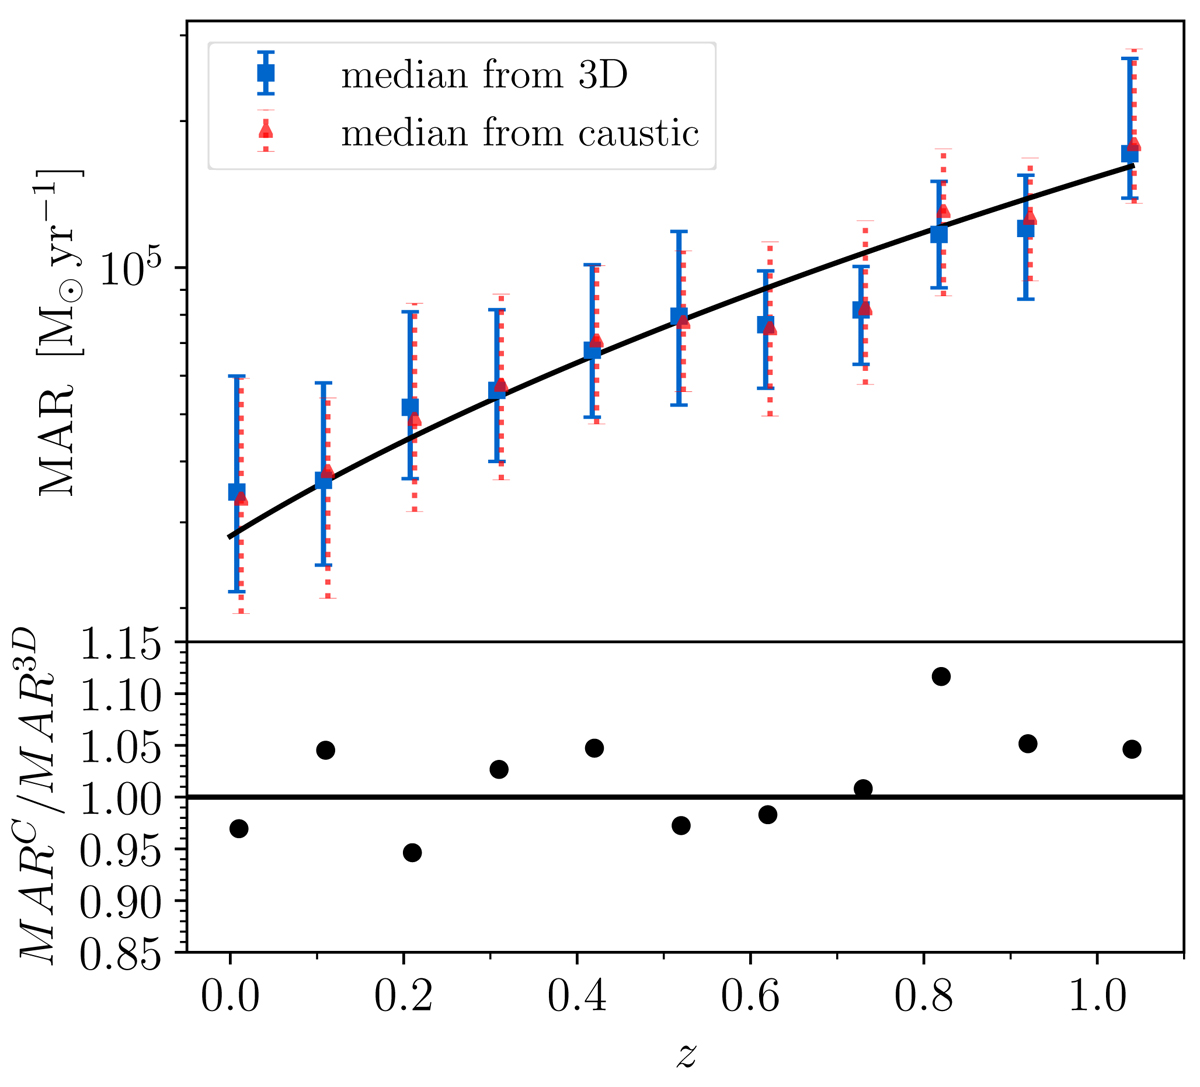
Comparison between MARC and MAR3D. Upper panel: median true (blue squares) and caustic (red triangles) MARs as a function of redshift. The solid blue and dotted red error bars show the interquartile ranges of the true and caustic MARs, respectively. The black curve shows a fit to Eq. (8). Lower panel: median ratio (black dots) between the caustic and true MARs as a function of redshift.
Current usage metrics show cumulative count of Article Views (full-text article views including HTML views, PDF and ePub downloads, according to the available data) and Abstracts Views on Vision4Press platform.
Data correspond to usage on the plateform after 2015. The current usage metrics is available 48-96 hours after online publication and is updated daily on week days.
Initial download of the metrics may take a while.