Open Access
Fig. 8.
Download original image
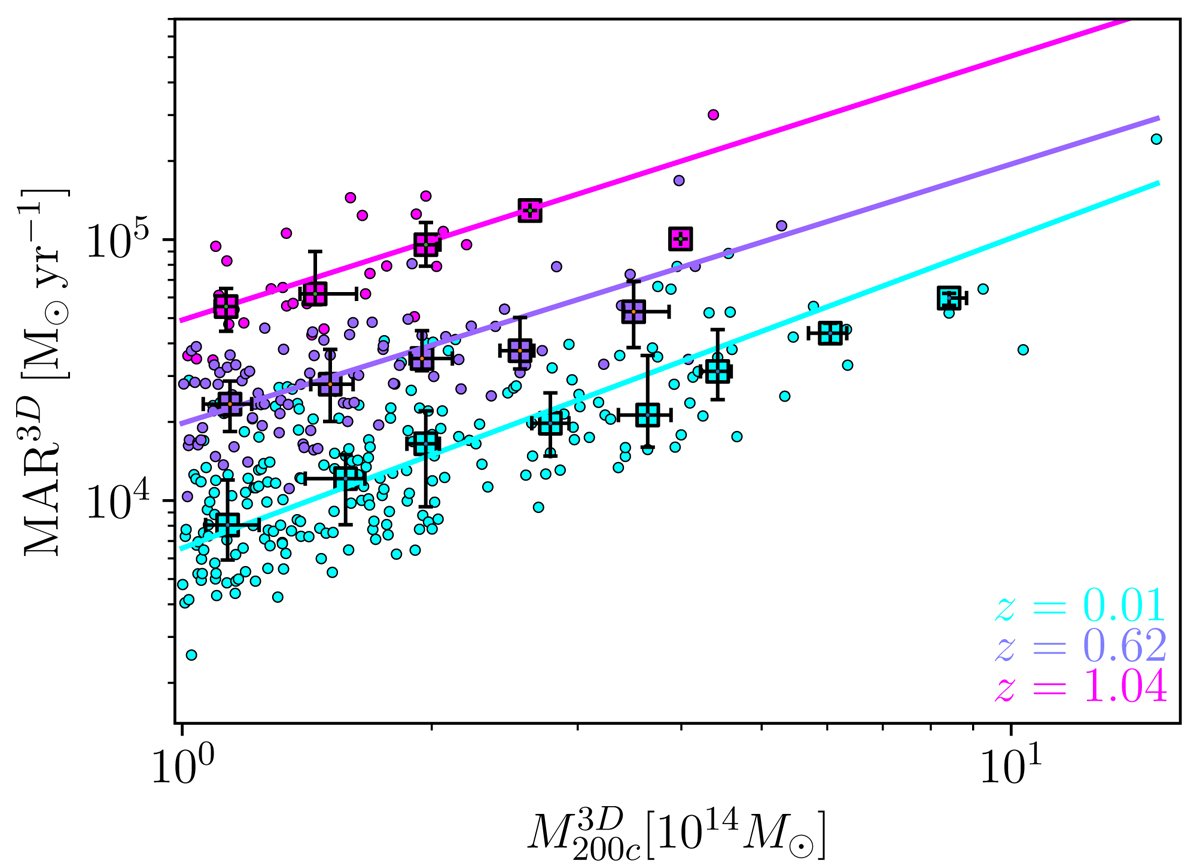
Relation between MAR3D and ![]() . The colored circles show MAR3D as a function of
. The colored circles show MAR3D as a function of ![]() in the three redshift bins z = 0.01, 0.62, and 1.04 (cyan, violet, and magenta, respectively). The squares with error bars show the median and interquartile range in eight fixed mass bins. The lines show power law fits to the data.
in the three redshift bins z = 0.01, 0.62, and 1.04 (cyan, violet, and magenta, respectively). The squares with error bars show the median and interquartile range in eight fixed mass bins. The lines show power law fits to the data.
Current usage metrics show cumulative count of Article Views (full-text article views including HTML views, PDF and ePub downloads, according to the available data) and Abstracts Views on Vision4Press platform.
Data correspond to usage on the plateform after 2015. The current usage metrics is available 48-96 hours after online publication and is updated daily on week days.
Initial download of the metrics may take a while.