Fig. 5.
Download original image
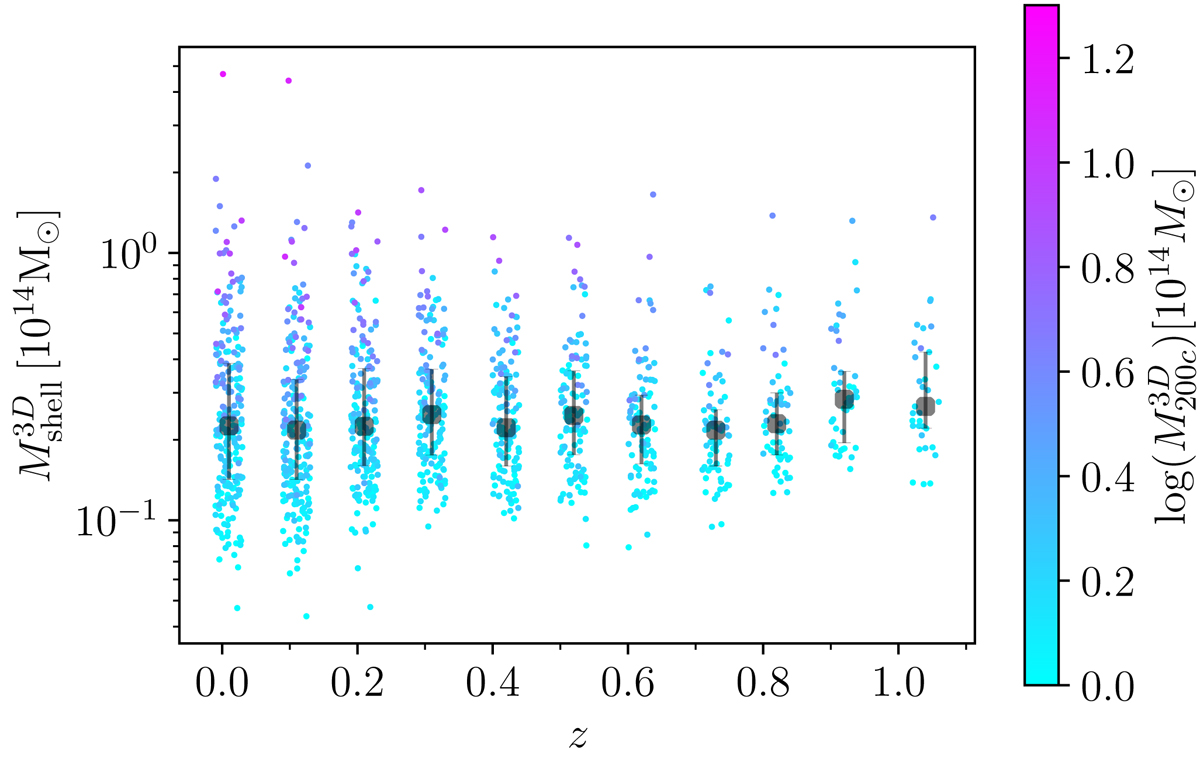
Relation between ![]() and redshift. The small circles show the
and redshift. The small circles show the ![]() of individual clusters as a function of redshift, color coded by
of individual clusters as a function of redshift, color coded by ![]() . The points include clusters over the entire redshift range. We introduced an artificial jitter on the exact redshifts to make the dependence of
. The points include clusters over the entire redshift range. We introduced an artificial jitter on the exact redshifts to make the dependence of ![]() on
on ![]() more evident. The transparent black circles with error bars show the median and interquartile range of
more evident. The transparent black circles with error bars show the median and interquartile range of ![]() in each redshift bin.
in each redshift bin.
Current usage metrics show cumulative count of Article Views (full-text article views including HTML views, PDF and ePub downloads, according to the available data) and Abstracts Views on Vision4Press platform.
Data correspond to usage on the plateform after 2015. The current usage metrics is available 48-96 hours after online publication and is updated daily on week days.
Initial download of the metrics may take a while.