Open Access
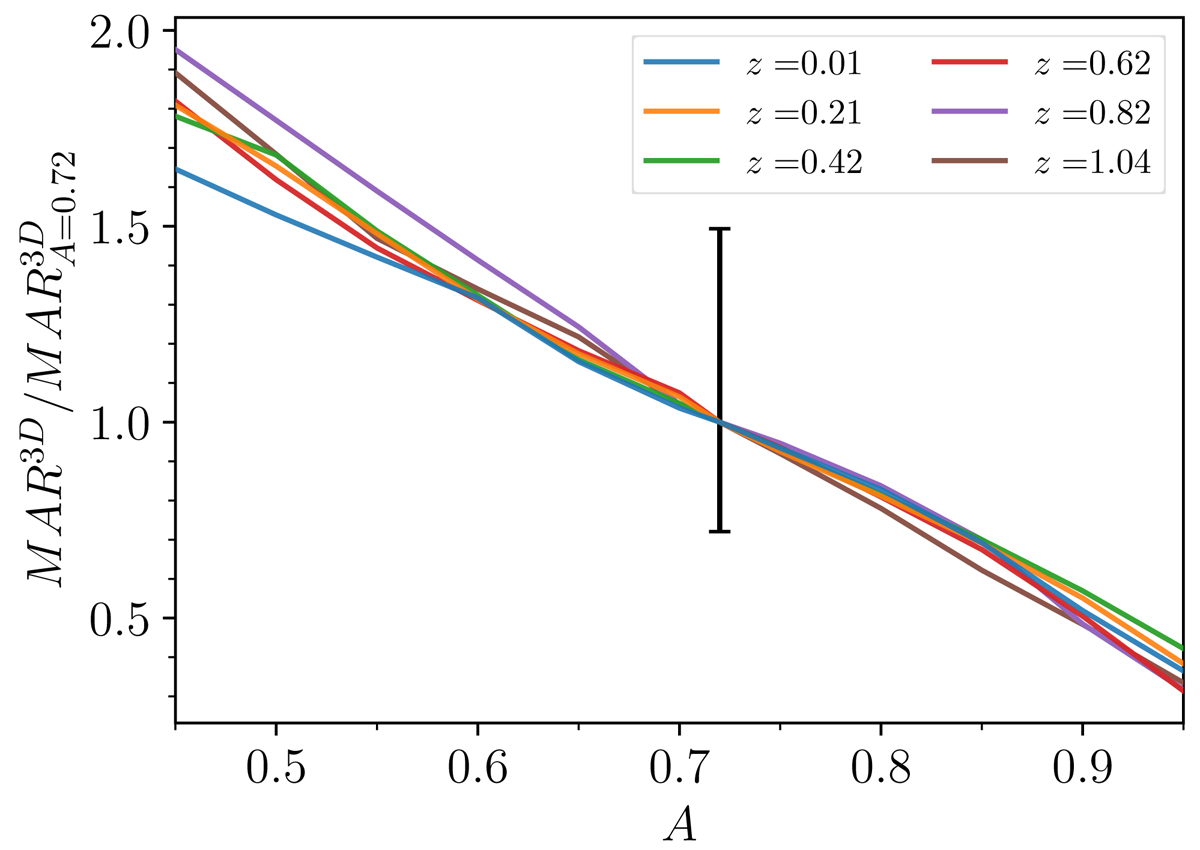
Fig. 3.
Download original image
Relation between MAR and MARt. The curves show MAR3D(A)/MAR3D(A = 0.72) as a function of A in the range of 0.45 − 0.95 for six redshifts from z = 0.01 to z = 1.04. The error bar shows the median interquartile range of the ratio at A = 0.72.
Current usage metrics show cumulative count of Article Views (full-text article views including HTML views, PDF and ePub downloads, according to the available data) and Abstracts Views on Vision4Press platform.
Data correspond to usage on the plateform after 2015. The current usage metrics is available 48-96 hours after online publication and is updated daily on week days.
Initial download of the metrics may take a while.