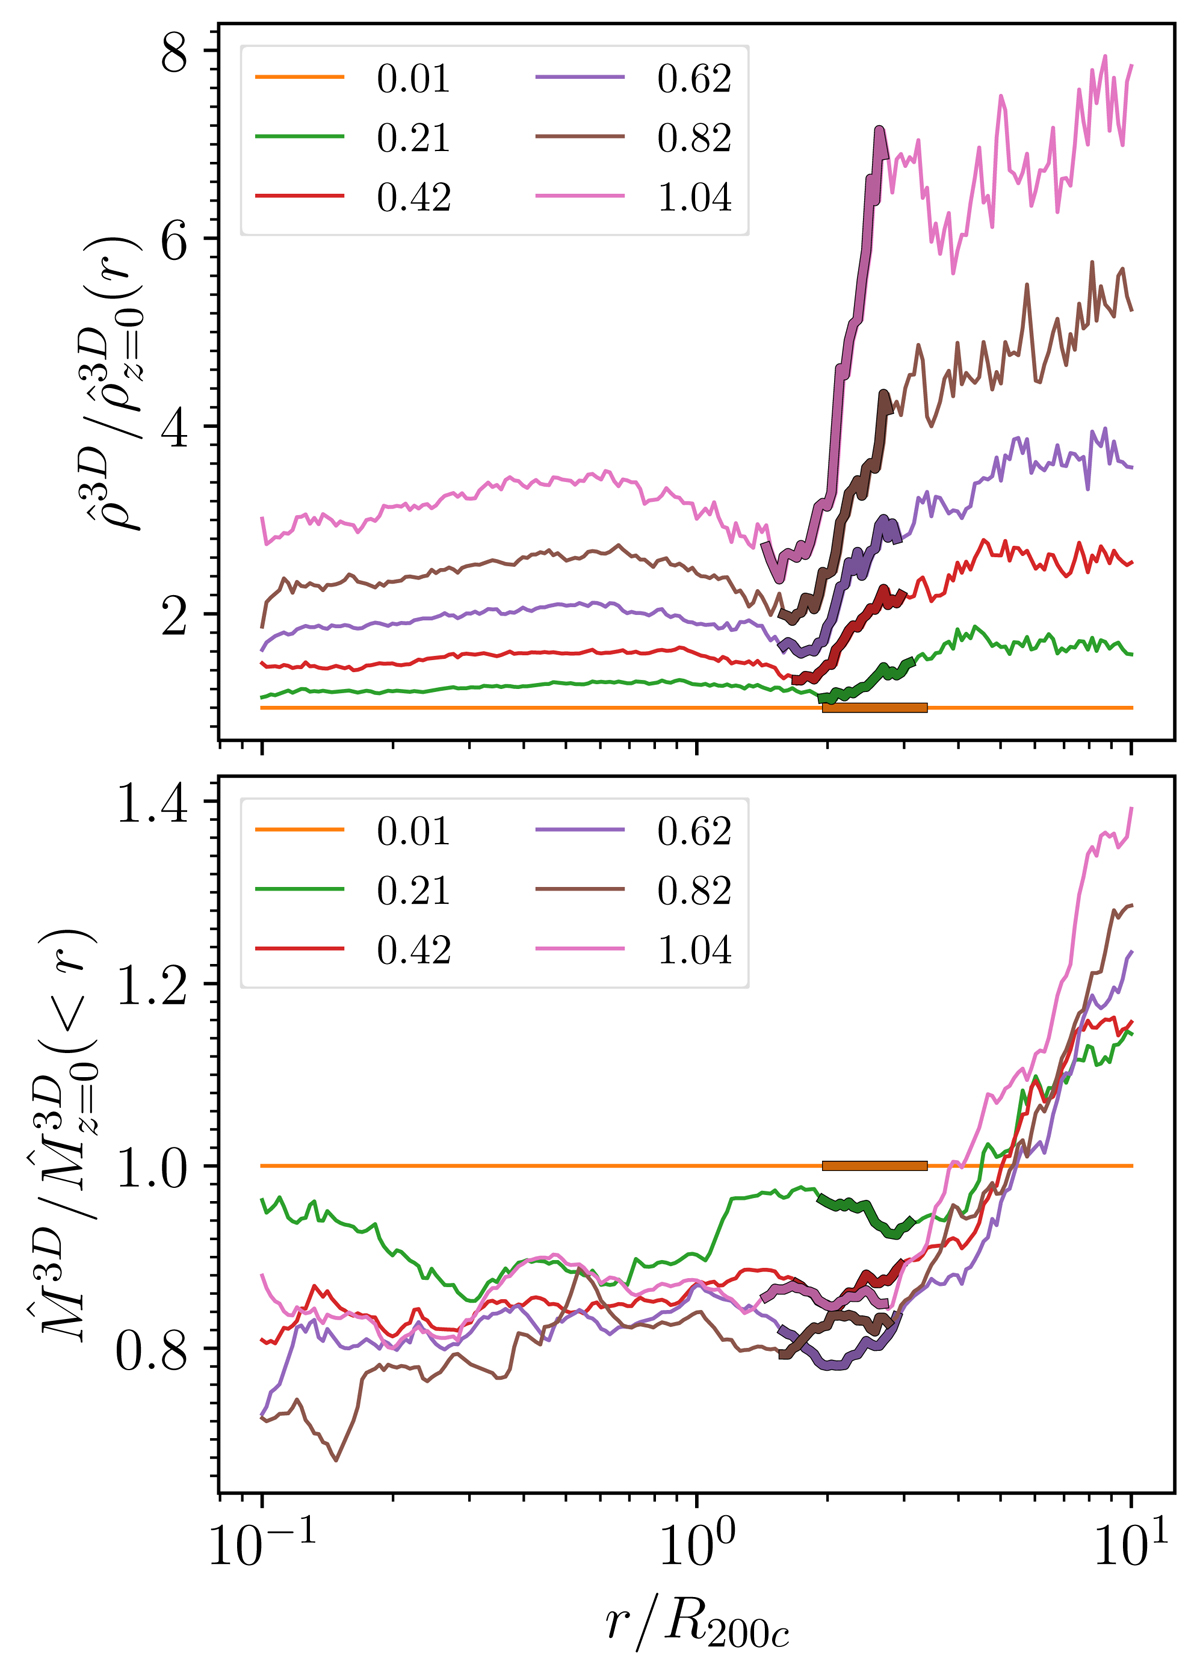
Fig. A.1.
Download original image
Average density and mass radial profiles as a function of redshift. Upper panel: Ratio between the median shell density of clusters at the six redshifts z = 0.01, 0.21, 0.42, 0.62, 0.82, and 1.04 relative to z = 0.01. The color coding is shown in the legend. The thick section of each ratio shows the infalling shell (Sect. 4.1, Table 3). Bottom panel: Same as the upper panel but for the median cumulative mass profile.
Current usage metrics show cumulative count of Article Views (full-text article views including HTML views, PDF and ePub downloads, according to the available data) and Abstracts Views on Vision4Press platform.
Data correspond to usage on the plateform after 2015. The current usage metrics is available 48-96 hours after online publication and is updated daily on week days.
Initial download of the metrics may take a while.