Fig. 11.
Download original image
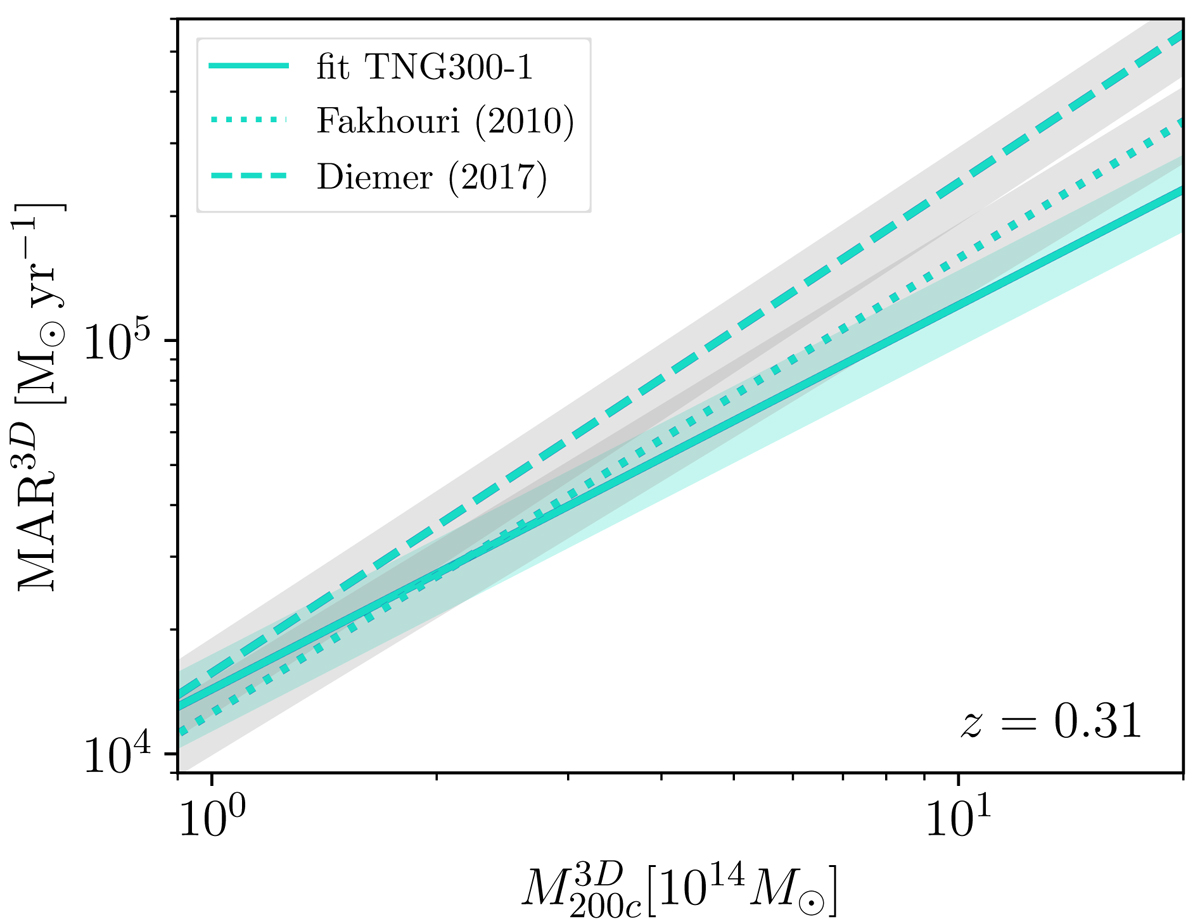
Comparison between fits to our MARs and previously published fits. The solid, dotted, and dashed lines show the fit of the analytic relation proposed by Fakhouri et al. (2010) to the IllustrisTNG MARs (Eq. (8), see Sect. 5), the fit by Fakhouri et al. (2010), and the fit by Diemer et al. (2017), respectively, at z = 0.31. The shadowed turquoise band shows the typical 1σ IllustrisTNG scatter. The gray shadow indicates a similar assumed scatter for the merger tree models (gray bands).
Current usage metrics show cumulative count of Article Views (full-text article views including HTML views, PDF and ePub downloads, according to the available data) and Abstracts Views on Vision4Press platform.
Data correspond to usage on the plateform after 2015. The current usage metrics is available 48-96 hours after online publication and is updated daily on week days.
Initial download of the metrics may take a while.