Fig. 10.
Download original image
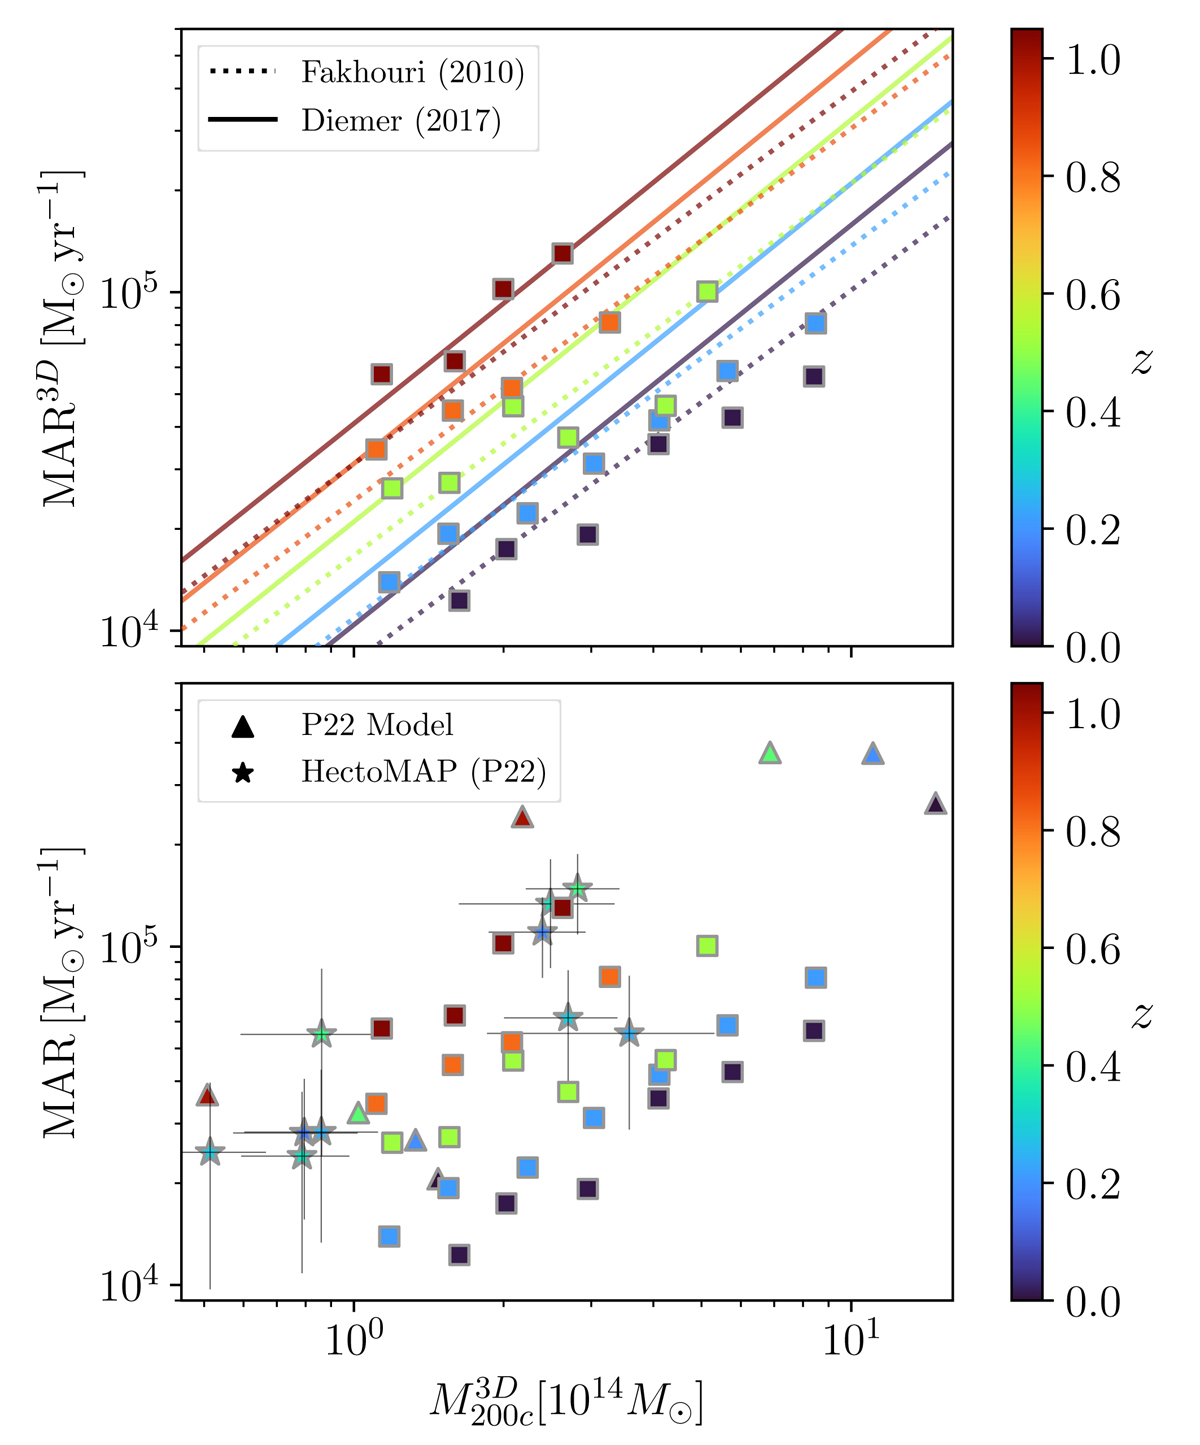
Comparison between our MARs and previously published results. Upper panel: squares show MAR3Ds from Fig. 8 as a function of ![]() and color coded by redshift, from dark blue to dark red as the redshift increases from bin to bin: z = 0.01, 0.21, 0.52, 0.82, and z = 1.04. The lines show MARs from merger trees by Fakhouri et al. (2010, dotted line) and by Diemer et al. (2017, solid line). Lower panel: squares again show the true MARs from TNG300-1 as a function of
and color coded by redshift, from dark blue to dark red as the redshift increases from bin to bin: z = 0.01, 0.21, 0.52, 0.82, and z = 1.04. The lines show MARs from merger trees by Fakhouri et al. (2010, dotted line) and by Diemer et al. (2017, solid line). Lower panel: squares again show the true MARs from TNG300-1 as a function of ![]() . Triangles show the MAR3Ds from Pizzardo et al. (2022) as a function of
. Triangles show the MAR3Ds from Pizzardo et al. (2022) as a function of ![]() in four redshift bins: z = 0.01, 0.19, 0.44, and z = 1.00. The stars show the MARs of ten observed stacked clusters from the HectoMAP survey (Pizzardo et al. 2022).
in four redshift bins: z = 0.01, 0.19, 0.44, and z = 1.00. The stars show the MARs of ten observed stacked clusters from the HectoMAP survey (Pizzardo et al. 2022).
Current usage metrics show cumulative count of Article Views (full-text article views including HTML views, PDF and ePub downloads, according to the available data) and Abstracts Views on Vision4Press platform.
Data correspond to usage on the plateform after 2015. The current usage metrics is available 48-96 hours after online publication and is updated daily on week days.
Initial download of the metrics may take a while.