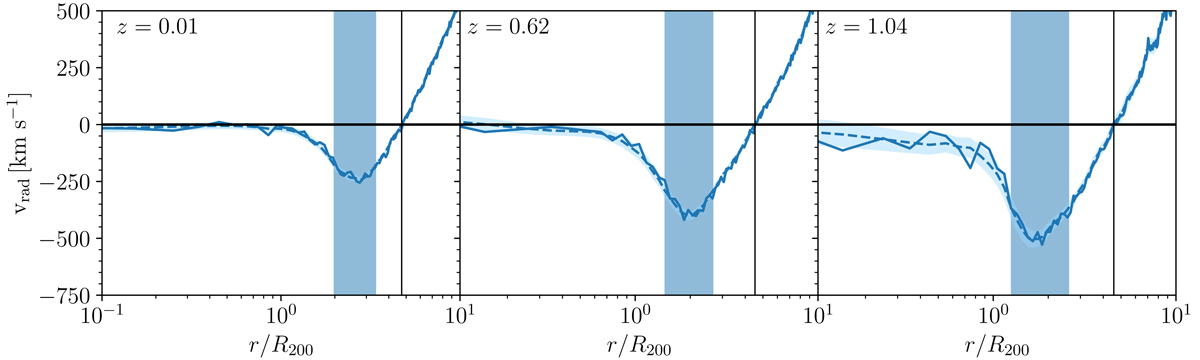
Fig. 1.
Download original image
Galaxy radial velocity profiles, infalling shells, and turnaround radii. The solid blue curves show the average galaxy radial velocity profiles for redshifts z = 0.01, z = 0.62, and z = 1.04 (left, middle, and right panels, respectively). The dashed blue curves show the Savitzky-Golay smoothed profiles based on a ten-bin window (Savitzky & Golay 1964). The shadowed region shows the error in the smoothed profile. The vertical black line shows the average turnaround radius based on the velocity profiles. In each panel the blue vertical band indicates the infalling shell with boundaries at cluster-centric radii where the velocity is 0.72vmin (Sect. 4).
Current usage metrics show cumulative count of Article Views (full-text article views including HTML views, PDF and ePub downloads, according to the available data) and Abstracts Views on Vision4Press platform.
Data correspond to usage on the plateform after 2015. The current usage metrics is available 48-96 hours after online publication and is updated daily on week days.
Initial download of the metrics may take a while.