Open Access
Fig. 8
Download original image
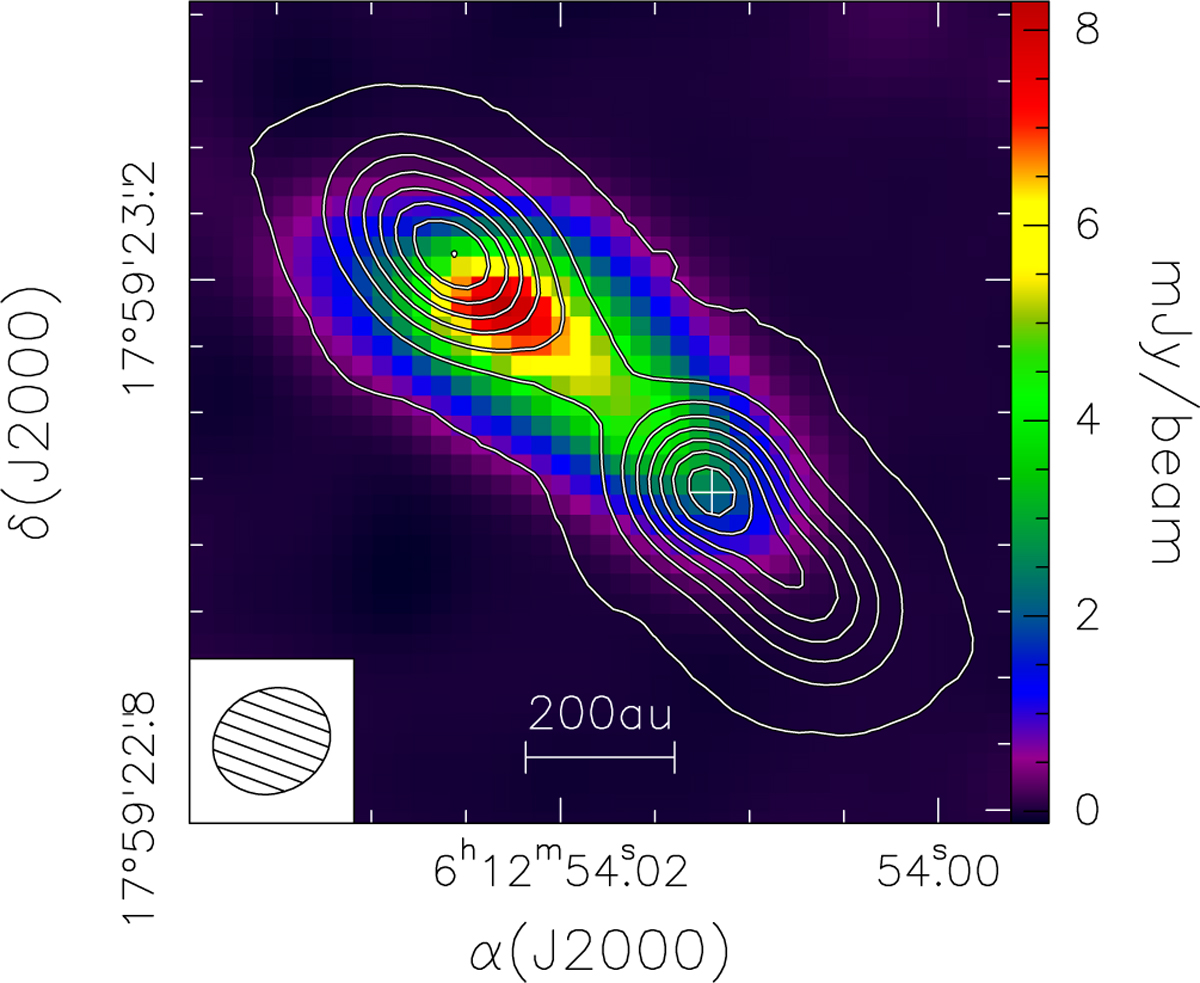
Map of the 3 mm continuum emission obtained with ALMA on September 3, 2021, overlaid on the 1.3 cm image obtained by OLHKP on May 5, 2018. Contour levels are the same as in Fig. 1b. The cross marks the position of the (proto)star. The ellipse in the bottom left represents the synthesised beam at 1.3 cm.
Current usage metrics show cumulative count of Article Views (full-text article views including HTML views, PDF and ePub downloads, according to the available data) and Abstracts Views on Vision4Press platform.
Data correspond to usage on the plateform after 2015. The current usage metrics is available 48-96 hours after online publication and is updated daily on week days.
Initial download of the metrics may take a while.