Fig. 7
Download original image
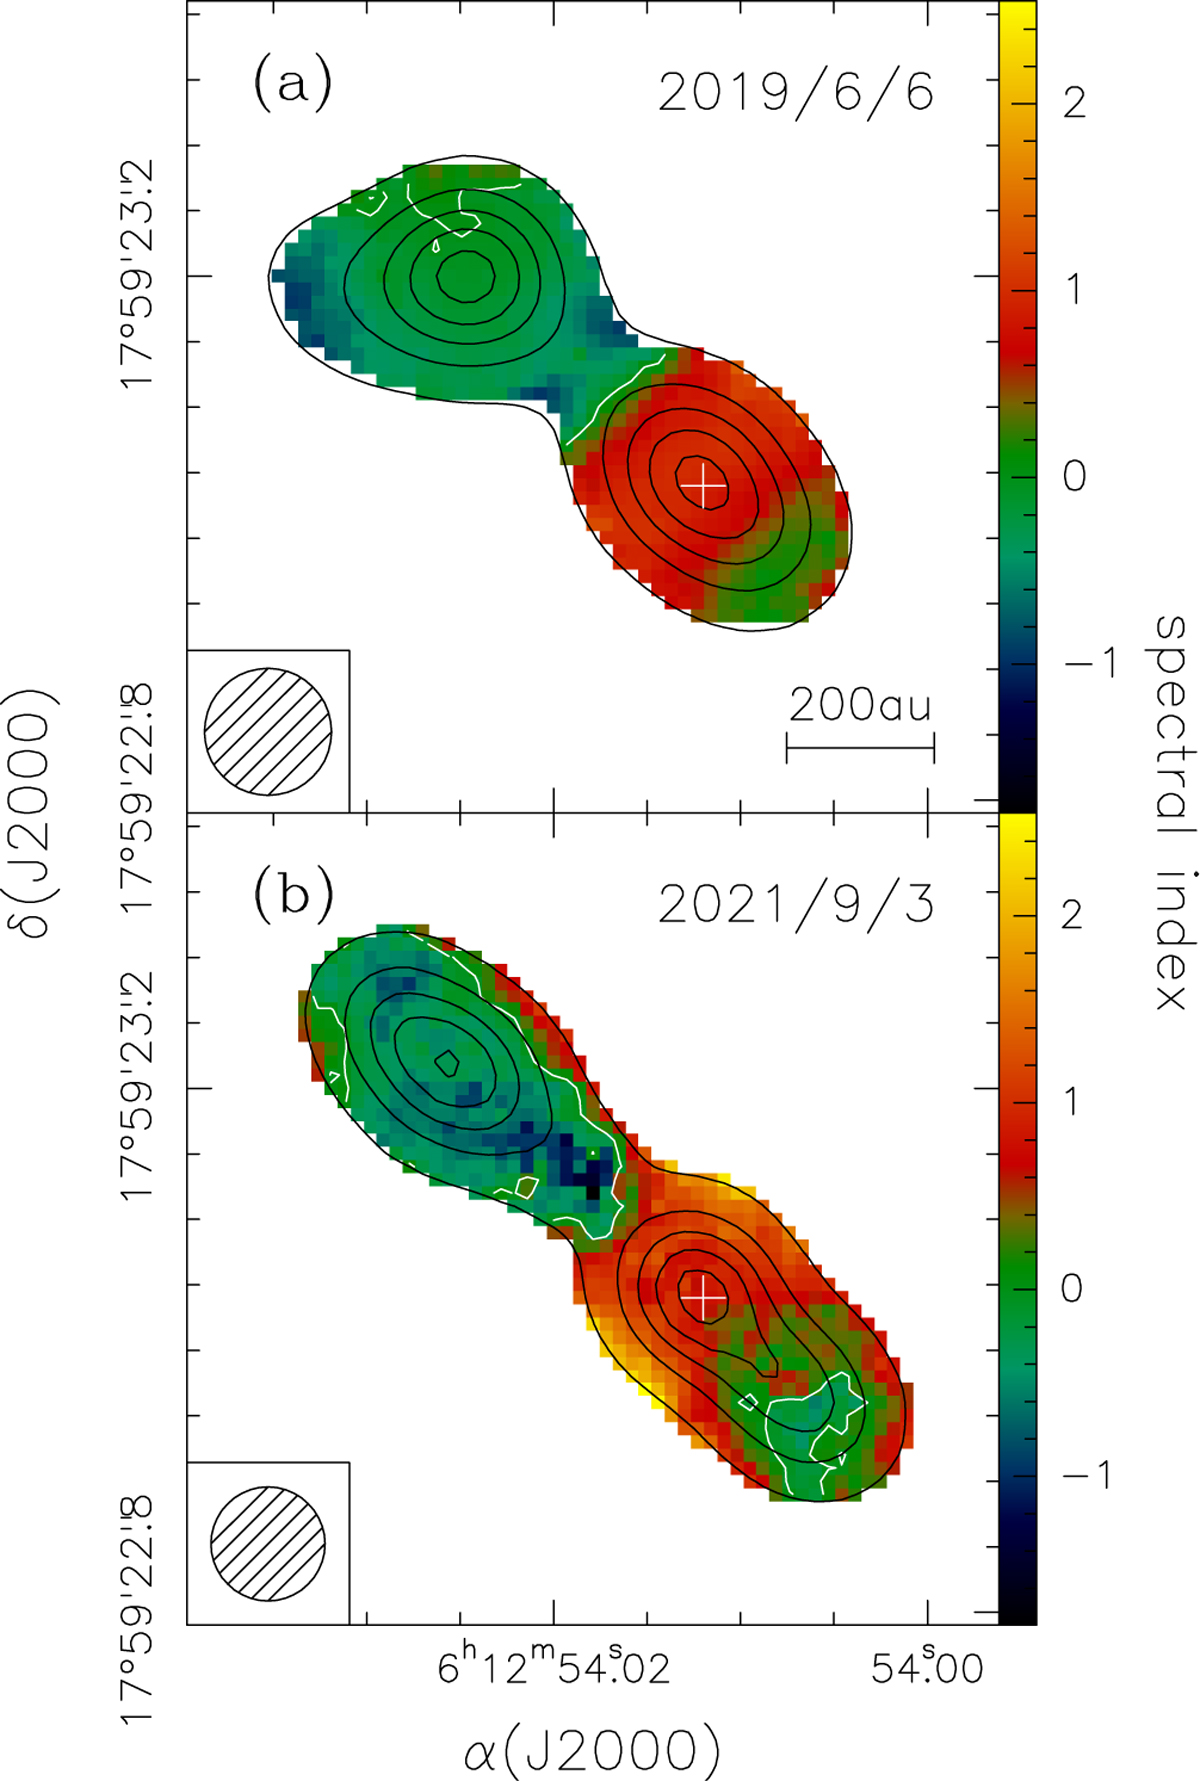
Maps of the 3 mm continuum emission (contours) overlaid on the corresponding map of the spectral index at 3 mm. (a) Data obtained with ALMA on June 6, 2019. Black contour levels range from 10% to 90% in steps of 10% of the peak emission. White contour levels correspond to a spectral index equal to 0. The cross marks the position of the (proto)star. The circle in the bottom left represents the synthesised beam. (b) Same as the top panel, but for the map obtained on September 3, 2021.
Current usage metrics show cumulative count of Article Views (full-text article views including HTML views, PDF and ePub downloads, according to the available data) and Abstracts Views on Vision4Press platform.
Data correspond to usage on the plateform after 2015. The current usage metrics is available 48-96 hours after online publication and is updated daily on week days.
Initial download of the metrics may take a while.