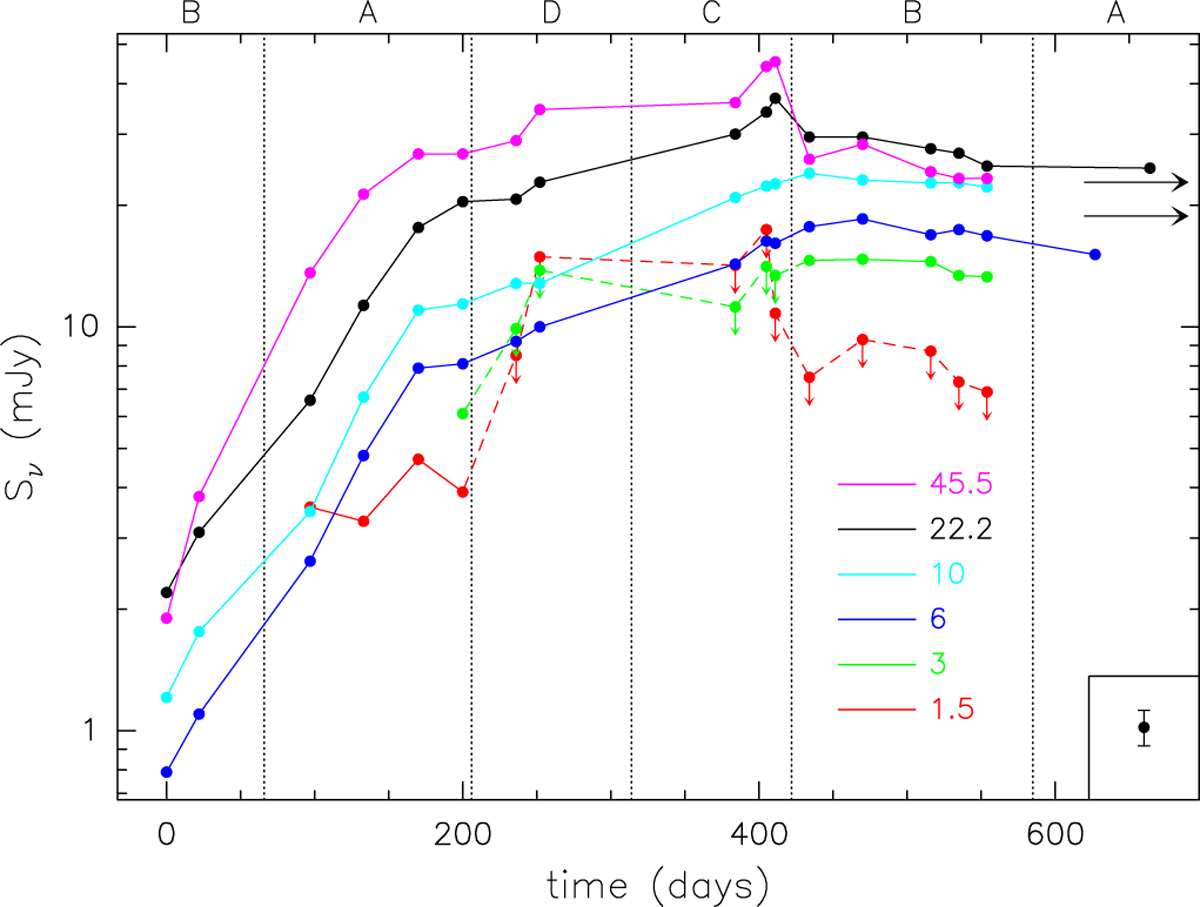
Fig. 6
Download original image
Flux density of the variable, compact source in S255IR NIRS 3 as a function of time from the beginning of the radio burst (July 10, 2016) in all bands observed with the VLA. The two rightmost points are the measurements at 6 and 22 GHz by OLHKP. Curves are colour-coded by frequency (in gigahertz). Arrows denote points with upper limits (see Sect. 2.1), which are connected by dashed lines. The two black arrows pointing to the right indicate the flux densities at 92 GHz of the NE lobe (see Table 1) measured 1061 and 1881 days after the radio burst. Typical error bars are shown in the bottom right of the figure. The vertical dotted lines mark the beginning and end of an array configuration, as labelled above the figure.
Current usage metrics show cumulative count of Article Views (full-text article views including HTML views, PDF and ePub downloads, according to the available data) and Abstracts Views on Vision4Press platform.
Data correspond to usage on the plateform after 2015. The current usage metrics is available 48-96 hours after online publication and is updated daily on week days.
Initial download of the metrics may take a while.