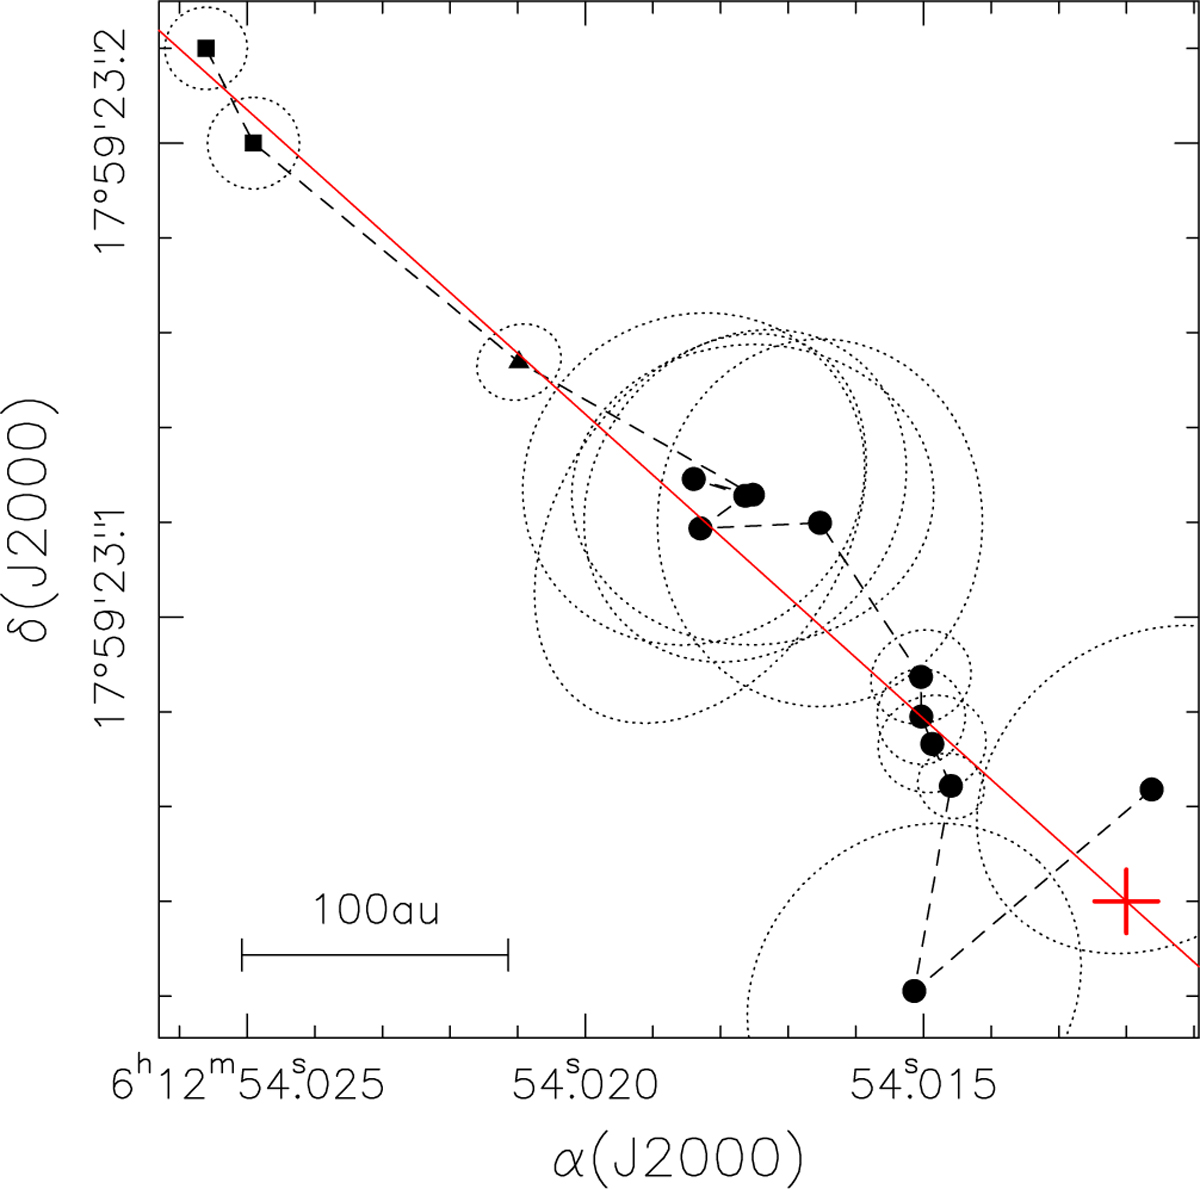
Fig. 5
Download original image
Distribution of the peaks of the 3 mm and 1.3 cm continuum maps obtained, respectively, with ALMA and with the A and B configurations of the VLA. The circles indicate our VLA data, the triangle the data of OLHKP, and the two squares our ALMA data. The dashed line connects the points in order of time (the first point in the bottom-right corner corresponds to the observation on July 10, 2016). The third point from the top left is obtained from the OLHKP data. The cross marks the position of the (proto)star, and the solid red line is the axis of the radio jet (PA = 48°). The dotted ellipses are the synthesised beams scaled down by a factor of 5.
Current usage metrics show cumulative count of Article Views (full-text article views including HTML views, PDF and ePub downloads, according to the available data) and Abstracts Views on Vision4Press platform.
Data correspond to usage on the plateform after 2015. The current usage metrics is available 48-96 hours after online publication and is updated daily on week days.
Initial download of the metrics may take a while.