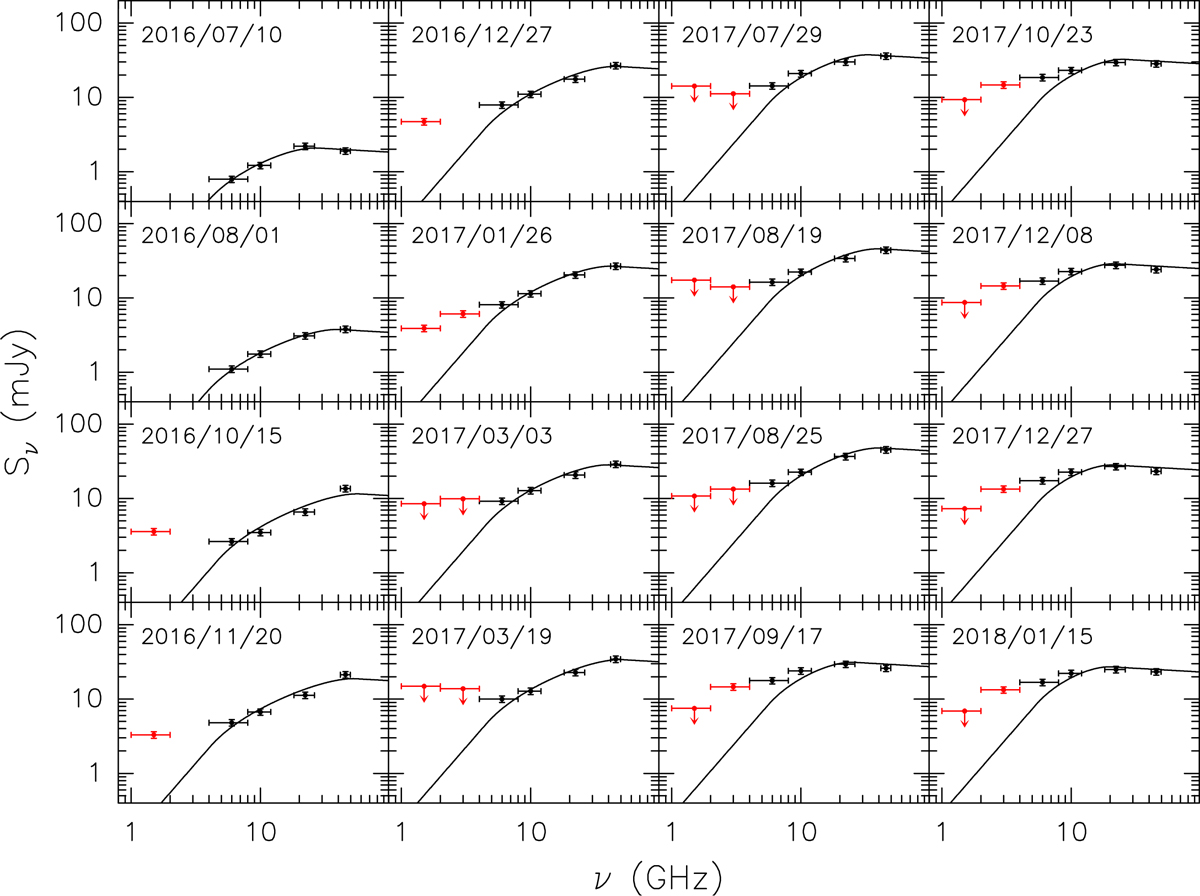
Fig. 4
Download original image
Continuum spectra of the variable, compact component in S255IR NIRS 3. The date of the observations is given in the top left of each panel. The vertical error bars assume a calibration error of 10% in all bands, while the horizontal bars indicate the bandwidth covered at each frequency. The upper limits denote that the flux density is also contributed by the emission from the large-scale lobes, due to the limited angular resolution. Red symbols mark data in the L (1.5 GHz) and S (3 GHz) bands. The curves are the best fits obtained with the model of a thermal jet described in Sect. 4.3.2.
Current usage metrics show cumulative count of Article Views (full-text article views including HTML views, PDF and ePub downloads, according to the available data) and Abstracts Views on Vision4Press platform.
Data correspond to usage on the plateform after 2015. The current usage metrics is available 48-96 hours after online publication and is updated daily on week days.
Initial download of the metrics may take a while.