Fig. 3
Download original image
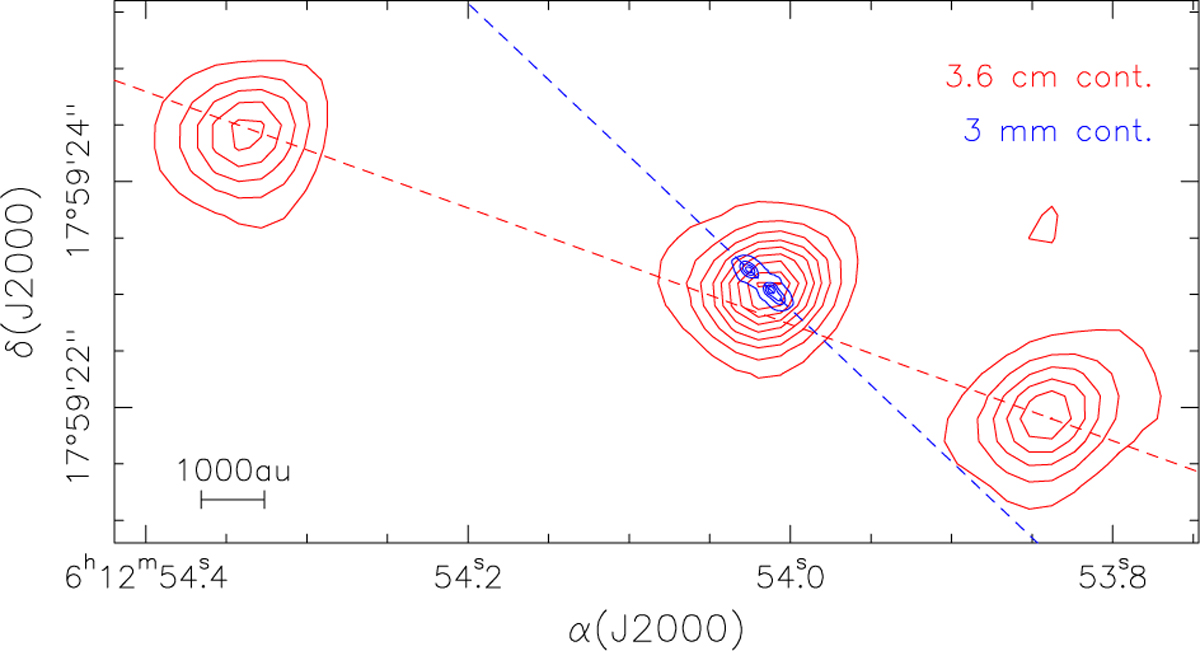
Maps of the 3.6 cm continuum emission obtained with the VLA on July 10, 2016 (red) and of the 3 mm continuum emission (blue), also shown in Fig. 1b. The dashed lines denote the symmetry axes of the bipolar structures. Red contour levels range from 0.1 to 0.6 in steps of 0.1 mJy beam−1. Blue contour levels range from 0.29 to 8.99 in steps of 2.9 mJy beam−1.
Current usage metrics show cumulative count of Article Views (full-text article views including HTML views, PDF and ePub downloads, according to the available data) and Abstracts Views on Vision4Press platform.
Data correspond to usage on the plateform after 2015. The current usage metrics is available 48-96 hours after online publication and is updated daily on week days.
Initial download of the metrics may take a while.