Fig. 11
Download original image
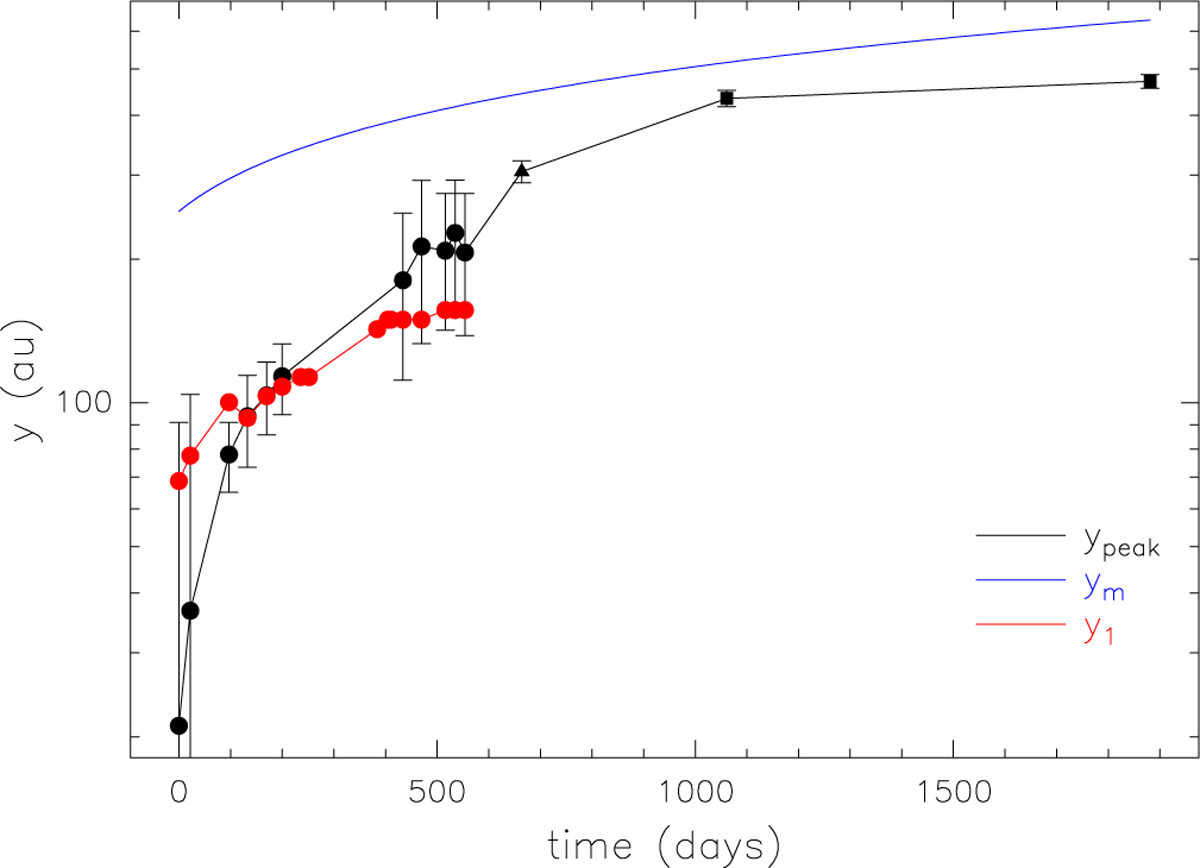
Comparison of the projection on the plane of the sky of the outer radius of the jet, ym (blue), with the position of the brightness temperature peak, ypeak (black), and the border between the optically thin and optically thick parts of the jet, y1 (red). All quantities are plotted as a function of time from the onset of the radio outburst (July 10, 2016). The black circles indicate our VLA data, the triangle the OLHKP data, and the two squares our ALMA data. We remark that ypeak is measured from Fig. 5 as the separation between the star and the projection of the peak along the jet axis.
Current usage metrics show cumulative count of Article Views (full-text article views including HTML views, PDF and ePub downloads, according to the available data) and Abstracts Views on Vision4Press platform.
Data correspond to usage on the plateform after 2015. The current usage metrics is available 48-96 hours after online publication and is updated daily on week days.
Initial download of the metrics may take a while.