Fig. 10
Download original image
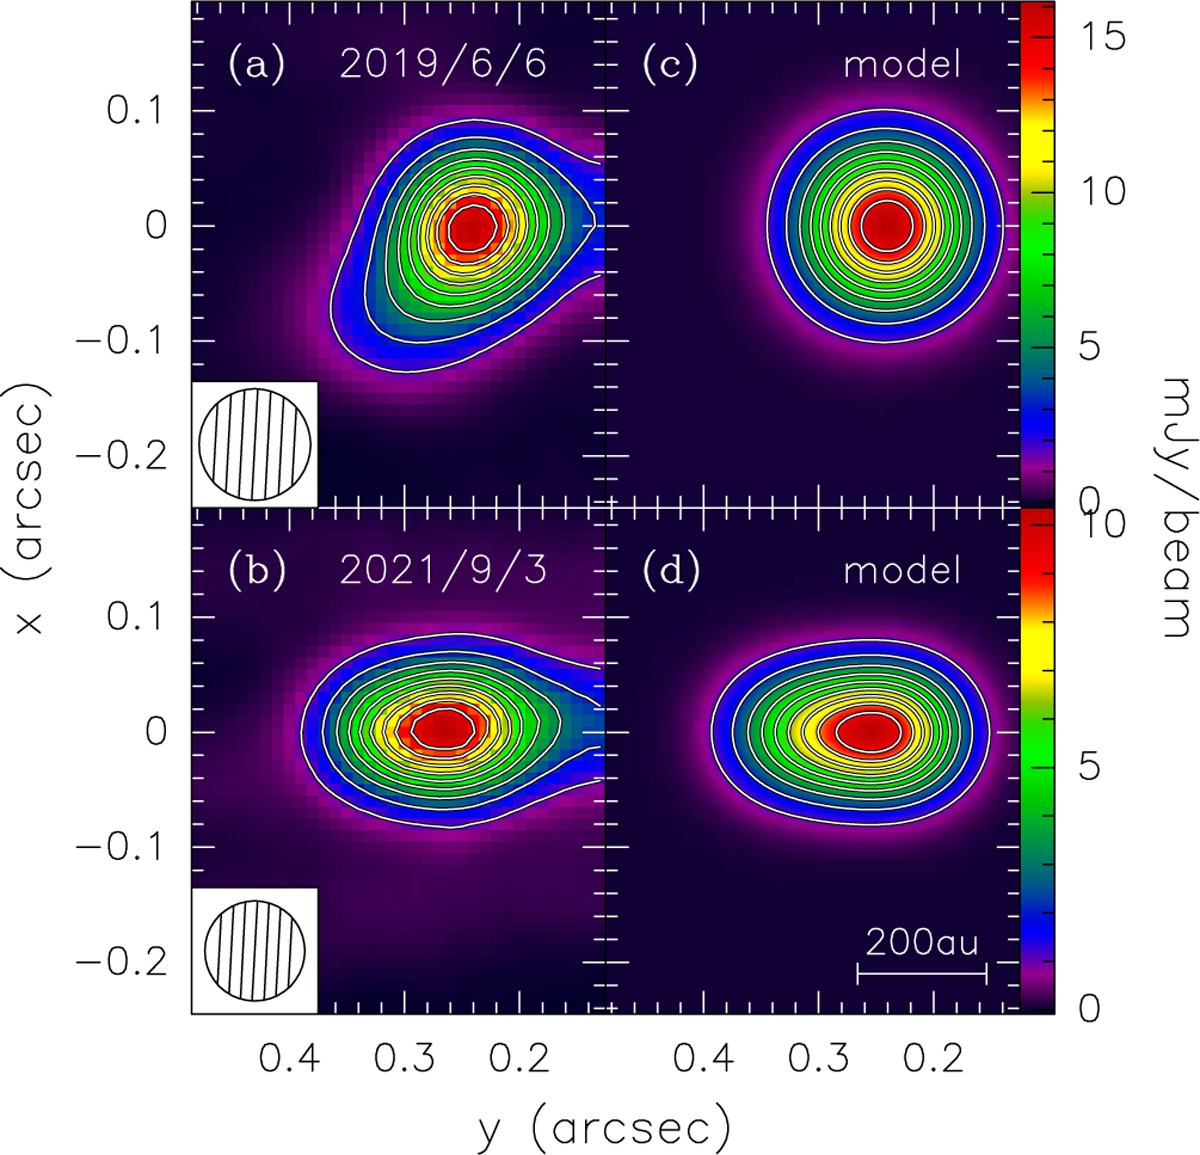
Comparison between the observed maps of the NE lobe of the radio jet (left panels) with the best-fit maps obtained with the model (right panels). The top panels correspond to the first ALMA epoch, bottom panels to the second one. The horizontal axis is parallel to the jet axis. Contour levels range from 10% to 90% in steps of 10% of the peak of each image. The circle in the bottom left represents the synthesised beam.
Current usage metrics show cumulative count of Article Views (full-text article views including HTML views, PDF and ePub downloads, according to the available data) and Abstracts Views on Vision4Press platform.
Data correspond to usage on the plateform after 2015. The current usage metrics is available 48-96 hours after online publication and is updated daily on week days.
Initial download of the metrics may take a while.