Fig. 9
Download original image
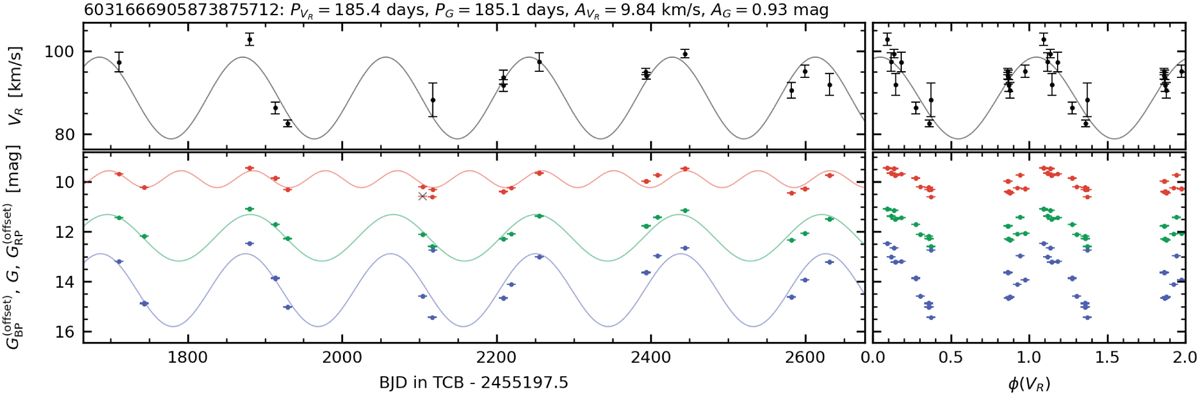
Example time series for a source with mixed consistency between the photometric and RV time series. This source has ![]() , while
, while ![]() . The panels in the top row show the RV data and model, while the photometric data and corresponding models are shown in the panels in the bottom row (in red, green, and blue for the GRP, G, and GBP bands, respectively). For visualization purposes, an arbitrary offset is applied to the GRP and GBP time series. The Gaia DR3 source ID of this object is indicated in the title, together with the period and semi-amplitude of the best-fit G-band and RV time series models. The panels on the right show the four time series folded by the RV period.
. The panels in the top row show the RV data and model, while the photometric data and corresponding models are shown in the panels in the bottom row (in red, green, and blue for the GRP, G, and GBP bands, respectively). For visualization purposes, an arbitrary offset is applied to the GRP and GBP time series. The Gaia DR3 source ID of this object is indicated in the title, together with the period and semi-amplitude of the best-fit G-band and RV time series models. The panels on the right show the four time series folded by the RV period.
Current usage metrics show cumulative count of Article Views (full-text article views including HTML views, PDF and ePub downloads, according to the available data) and Abstracts Views on Vision4Press platform.
Data correspond to usage on the plateform after 2015. The current usage metrics is available 48-96 hours after online publication and is updated daily on week days.
Initial download of the metrics may take a while.