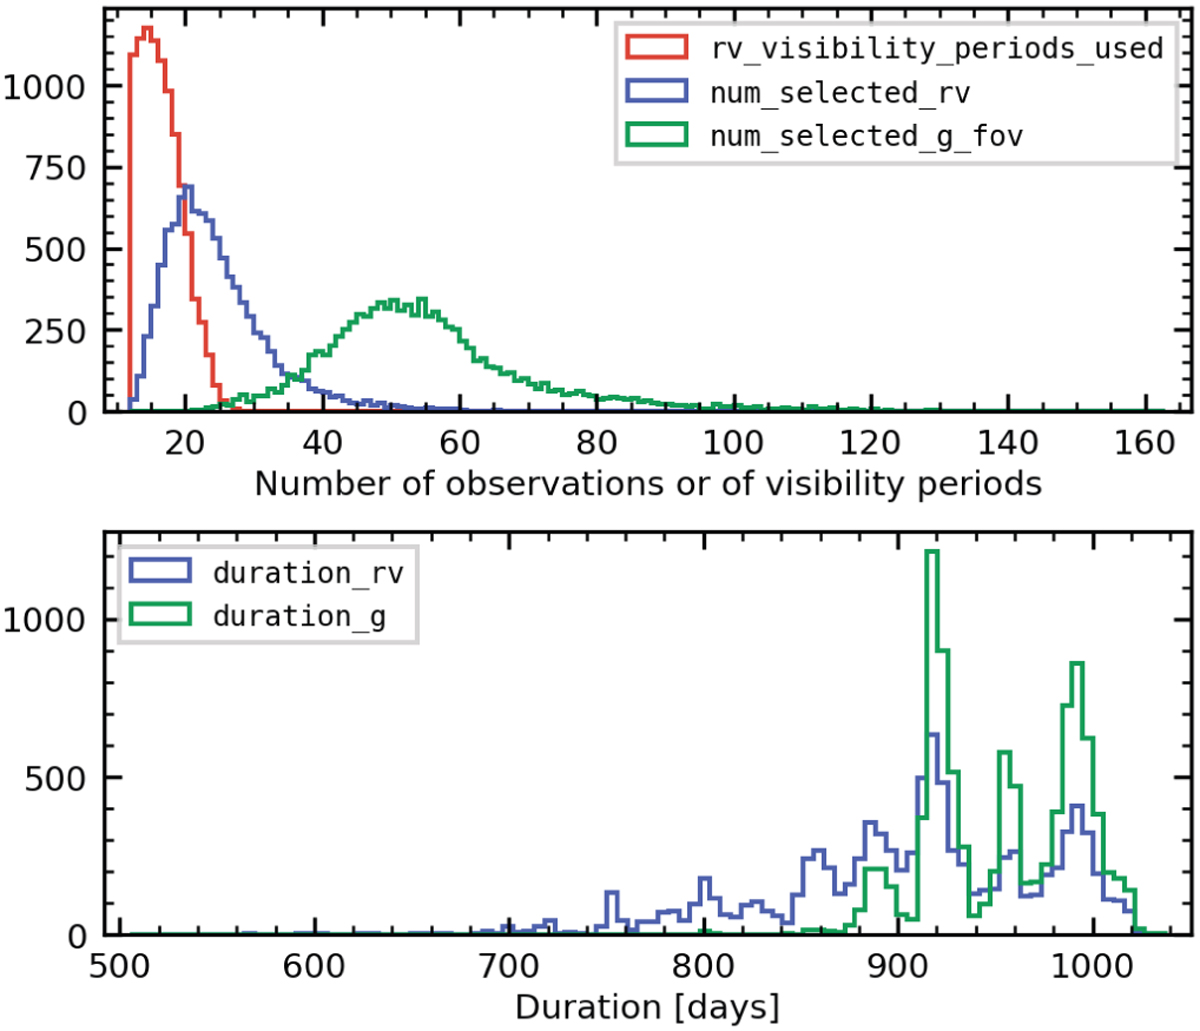
Fig. 8
Download original image
Distribution of the number of observations (top) and duration (bottom) of the RV and G-band time series of the FPR sources. The red line indicates the number visibility periods used to derive the median RV published in DR3 (a single visibility period may contain multiple epochs, see Sect. 2.1). The blue and green lines indicate the number of measurements in the cleaned RV and G-band time series (top) or their duration (bottom).
Current usage metrics show cumulative count of Article Views (full-text article views including HTML views, PDF and ePub downloads, according to the available data) and Abstracts Views on Vision4Press platform.
Data correspond to usage on the plateform after 2015. The current usage metrics is available 48-96 hours after online publication and is updated daily on week days.
Initial download of the metrics may take a while.