Fig. 6
Download original image
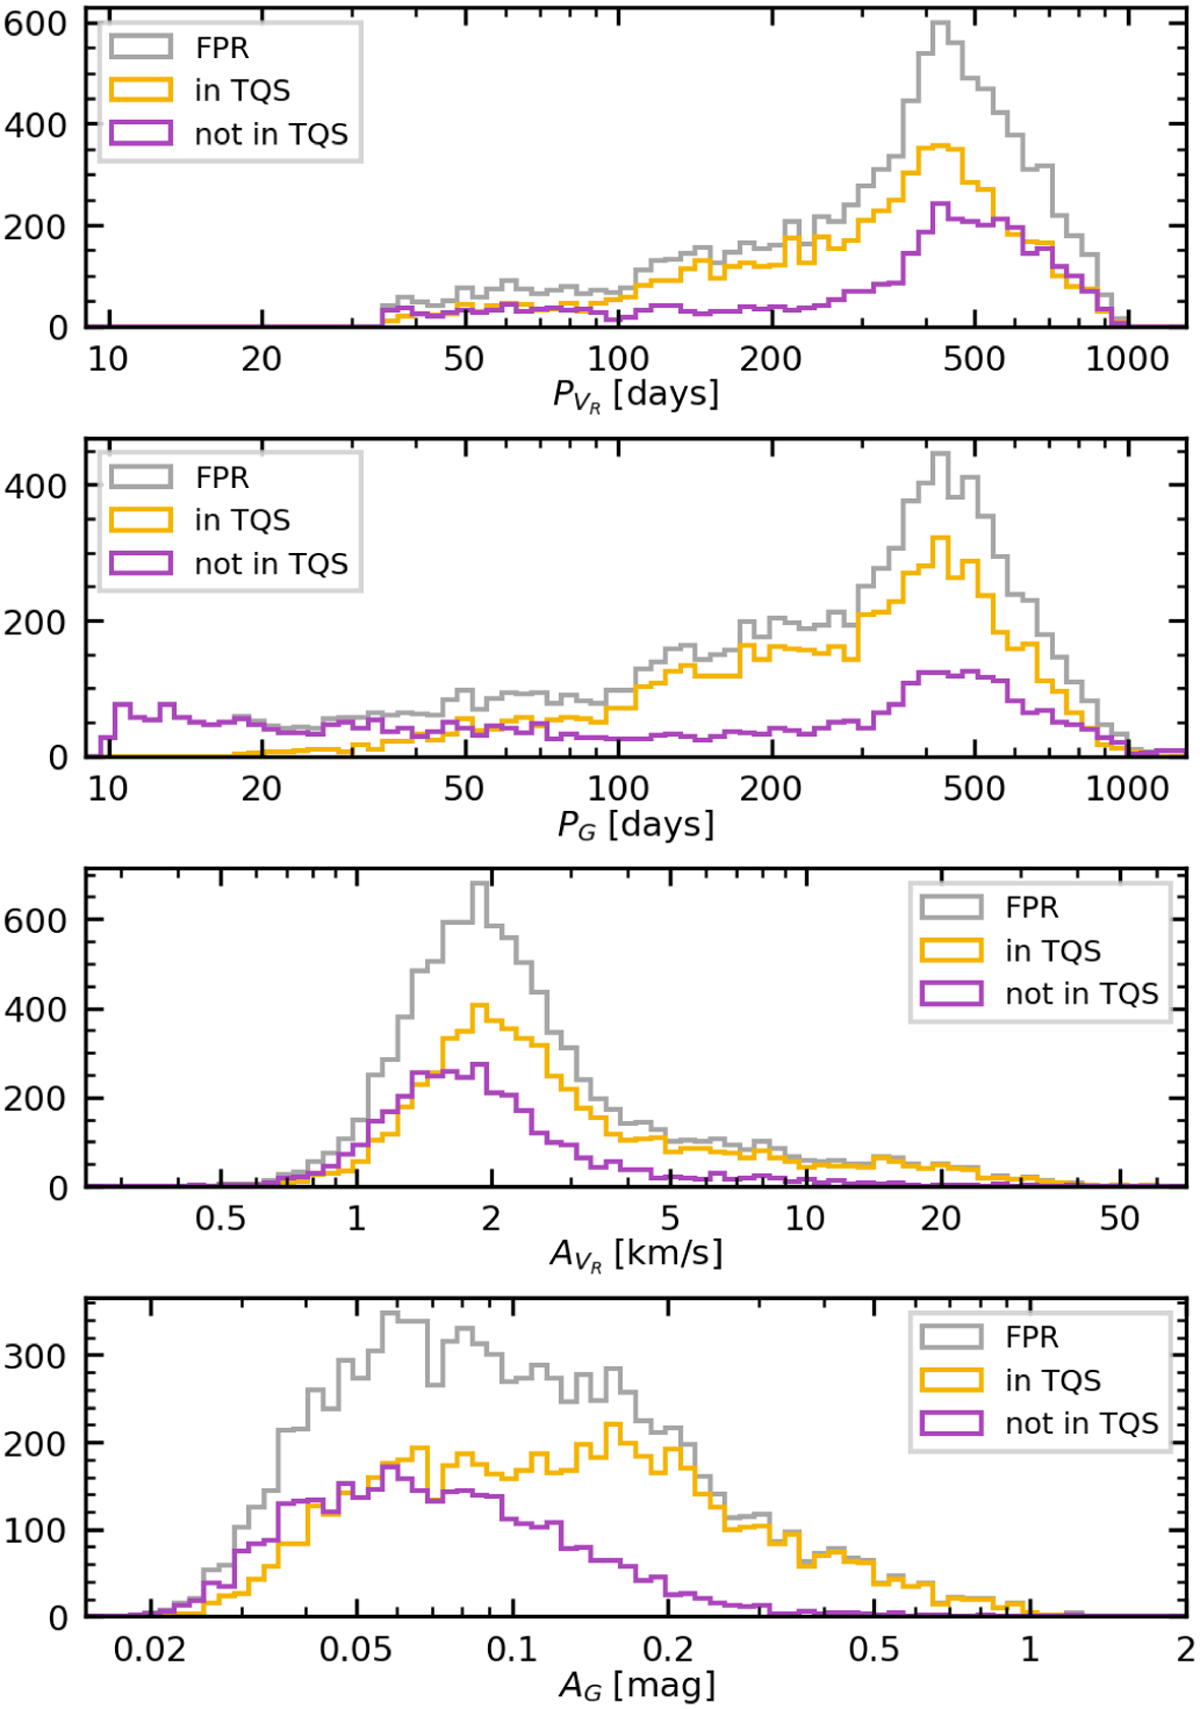
Distribution of the RV and G-band variability parameters for the all the FPR sources (gray curves), and distinguishing between whether they are in the top-quality sample (TQS, orange curves) or not (purple curves). Panels from top to bottom show the distributions of RV periods (![]() ), G-band periods (PG), RV semi-amplitudes (
), G-band periods (PG), RV semi-amplitudes (![]() ) and G-band semi-amplitudes (AG).
) and G-band semi-amplitudes (AG).
Current usage metrics show cumulative count of Article Views (full-text article views including HTML views, PDF and ePub downloads, according to the available data) and Abstracts Views on Vision4Press platform.
Data correspond to usage on the plateform after 2015. The current usage metrics is available 48-96 hours after online publication and is updated daily on week days.
Initial download of the metrics may take a while.