Fig. 5
Download original image
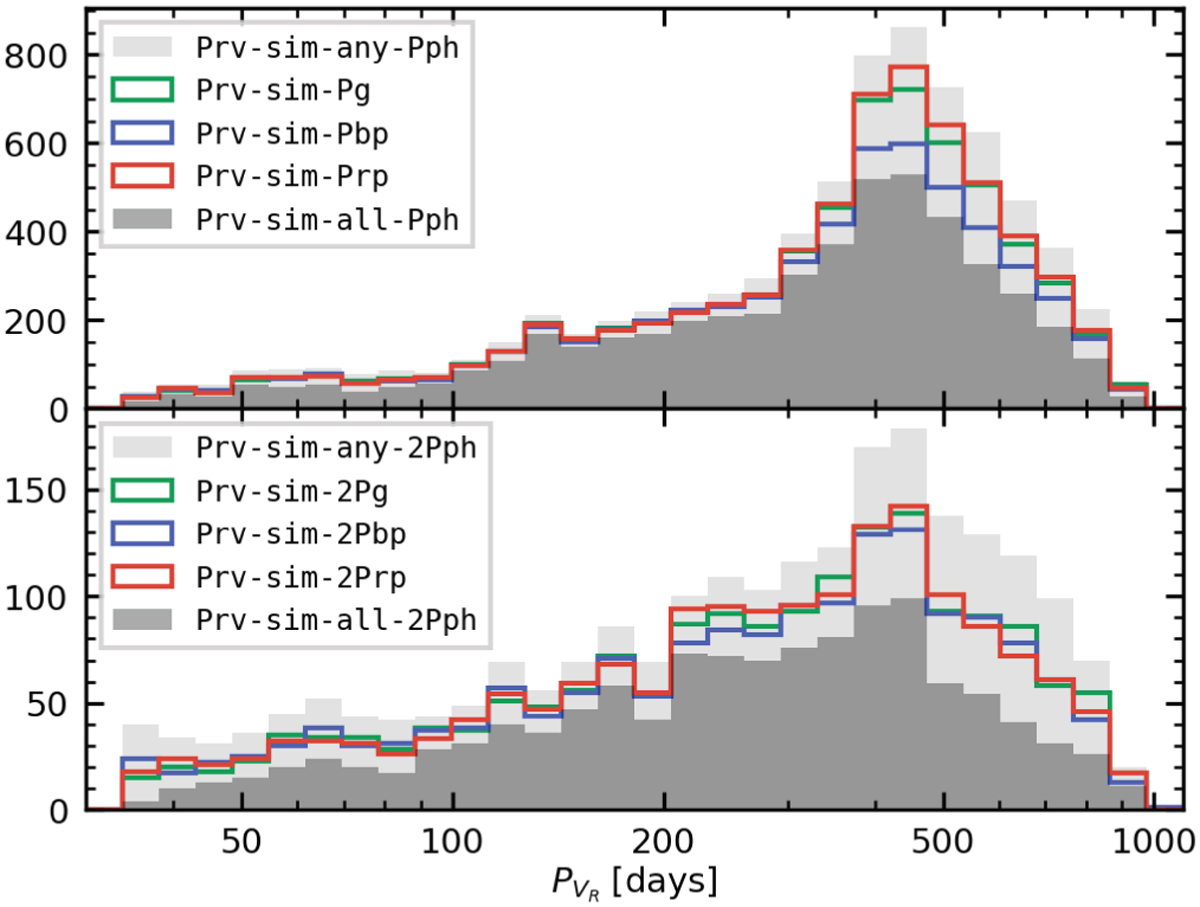
Period distribution, after applying filter-2, for the subsets with RV period similar to one or more photometric periods (top panel), or twice of it (bottom panel). The light gray and dark gray histograms represent the sets in which the RV period is similar to at least one photometric period or to all of them, respectively. The colored curves represent the sets in which the RV period is similar to PG (green), ![]() (blue), or
(blue), or ![]() (red).
(red).
Current usage metrics show cumulative count of Article Views (full-text article views including HTML views, PDF and ePub downloads, according to the available data) and Abstracts Views on Vision4Press platform.
Data correspond to usage on the plateform after 2015. The current usage metrics is available 48-96 hours after online publication and is updated daily on week days.
Initial download of the metrics may take a while.