Fig. 4
Download original image
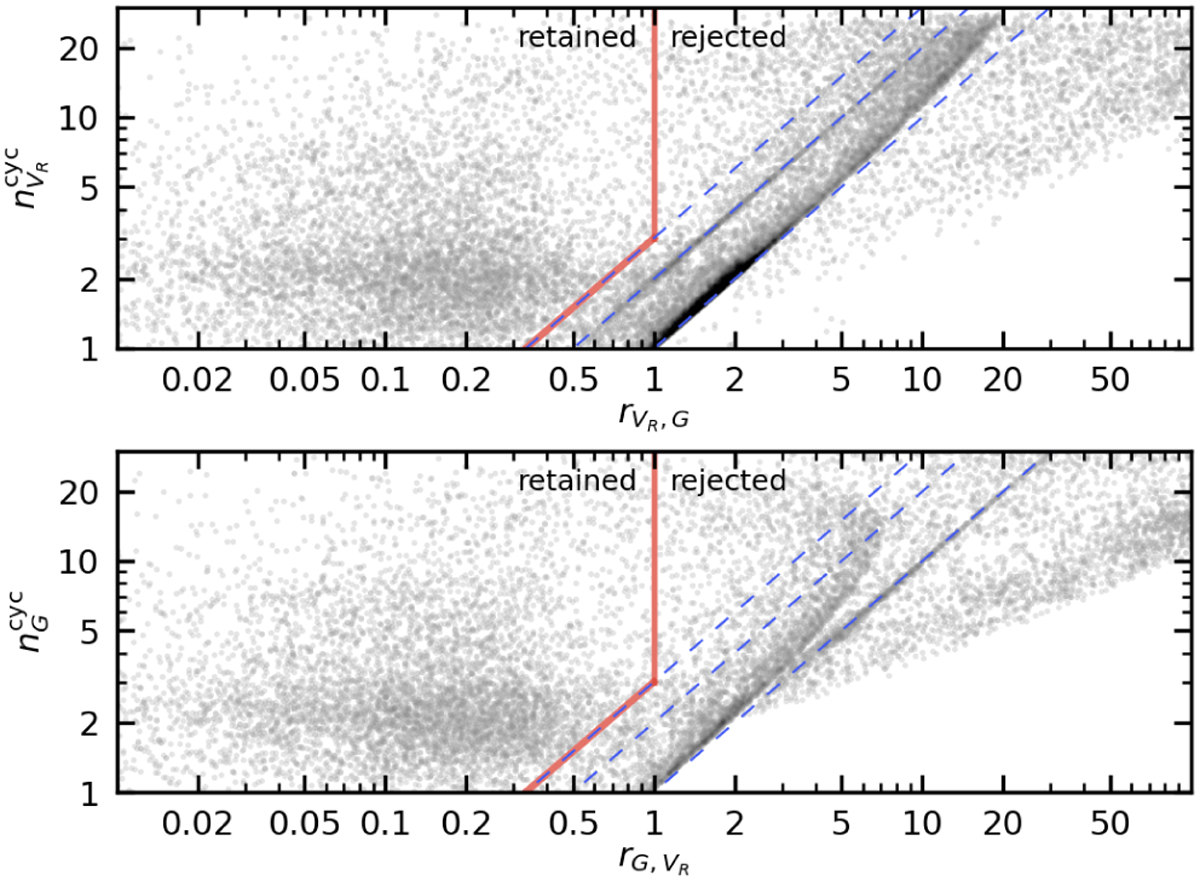
Number of observed cycles versus phase deviation at the last cycle, comparing the RV and G-band curve models for the sample post-filtered down to filter-2 (see Table 1). More precisely, the top panel shows the phase deviation ![]() with respect to the last RV cycle and the number
with respect to the last RV cycle and the number ![]() of RV cycles, while the same quantities are referred to the G-band time series in the bottom panel. In each panel, the thick red line marks the upper limit to the phase difference employed in post-filtering (Eq. (4)), while the dashed lines indicate ncyc/r = 3, 2, and 1. Data points to the right of the thick red line are rejected. A similar picture emerges when the GBP or GRP time series are considered in place of G.
of RV cycles, while the same quantities are referred to the G-band time series in the bottom panel. In each panel, the thick red line marks the upper limit to the phase difference employed in post-filtering (Eq. (4)), while the dashed lines indicate ncyc/r = 3, 2, and 1. Data points to the right of the thick red line are rejected. A similar picture emerges when the GBP or GRP time series are considered in place of G.
Current usage metrics show cumulative count of Article Views (full-text article views including HTML views, PDF and ePub downloads, according to the available data) and Abstracts Views on Vision4Press platform.
Data correspond to usage on the plateform after 2015. The current usage metrics is available 48-96 hours after online publication and is updated daily on week days.
Initial download of the metrics may take a while.