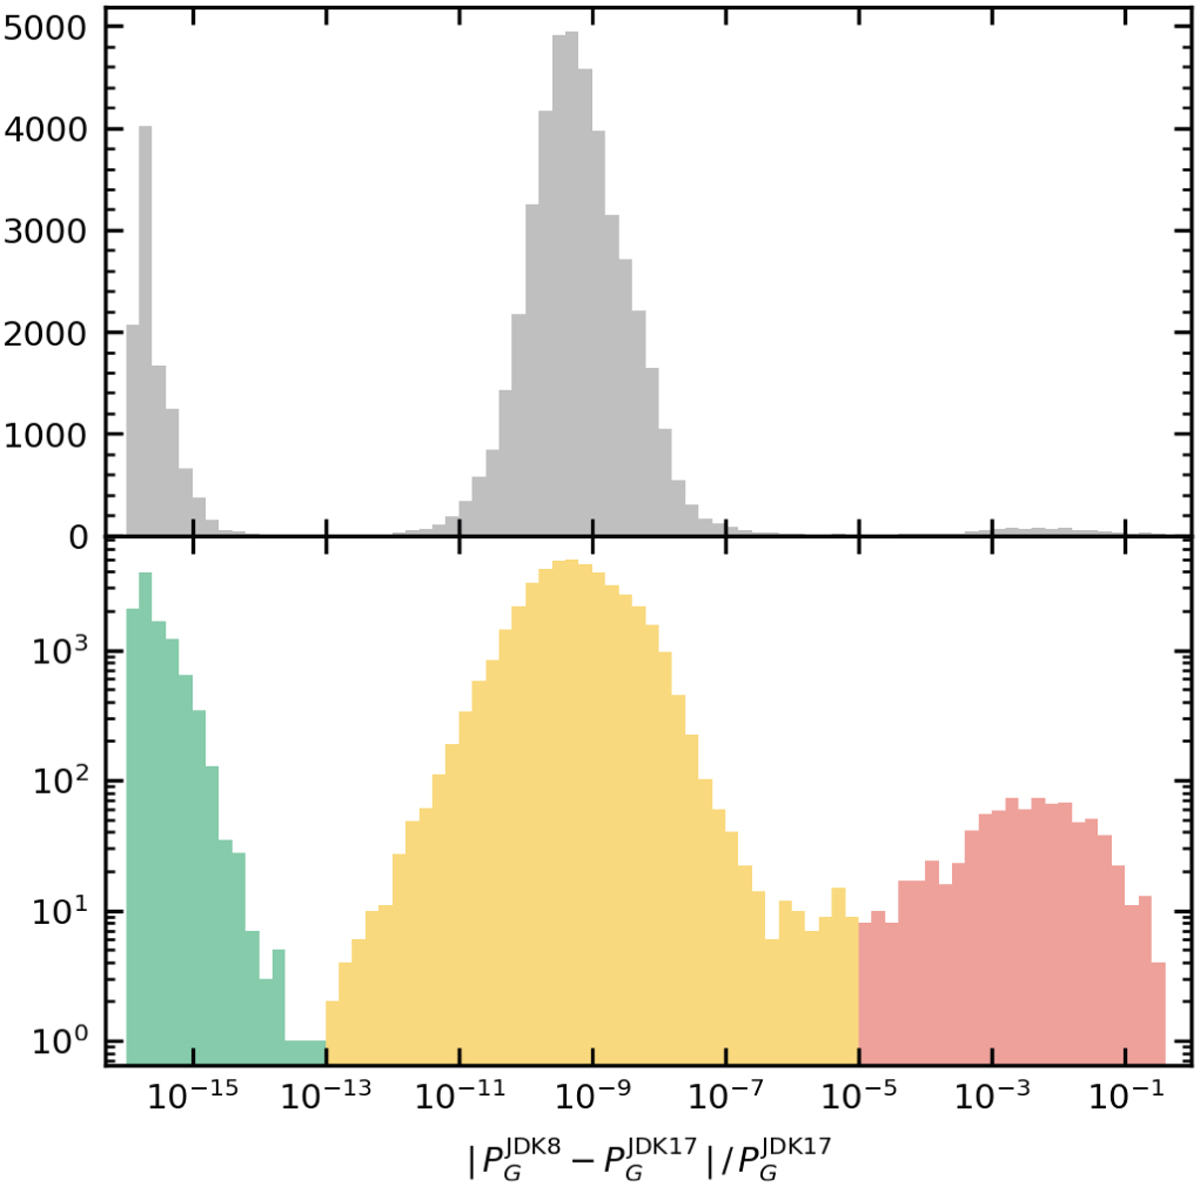
Fig. C.1
Download original image
Distribution of relative differences between the period derived for G-band time series before and after the upgrade of the variability pipeline from JDK-8 to JDK-17. A linear scale is used in the top panel for the vertical axis, while a log-scale is used in the bottom panel. Three distinct groups are identified, colored in the bottom panel in green, orange and red, corresponding to various levels of difference. We note that only in the latter group the differences are non-negligible (being typically of order 1%). This group is so small that it is barely visible in the top panel.
Current usage metrics show cumulative count of Article Views (full-text article views including HTML views, PDF and ePub downloads, according to the available data) and Abstracts Views on Vision4Press platform.
Data correspond to usage on the plateform after 2015. The current usage metrics is available 48-96 hours after online publication and is updated daily on week days.
Initial download of the metrics may take a while.