Fig. B.2
Download original image
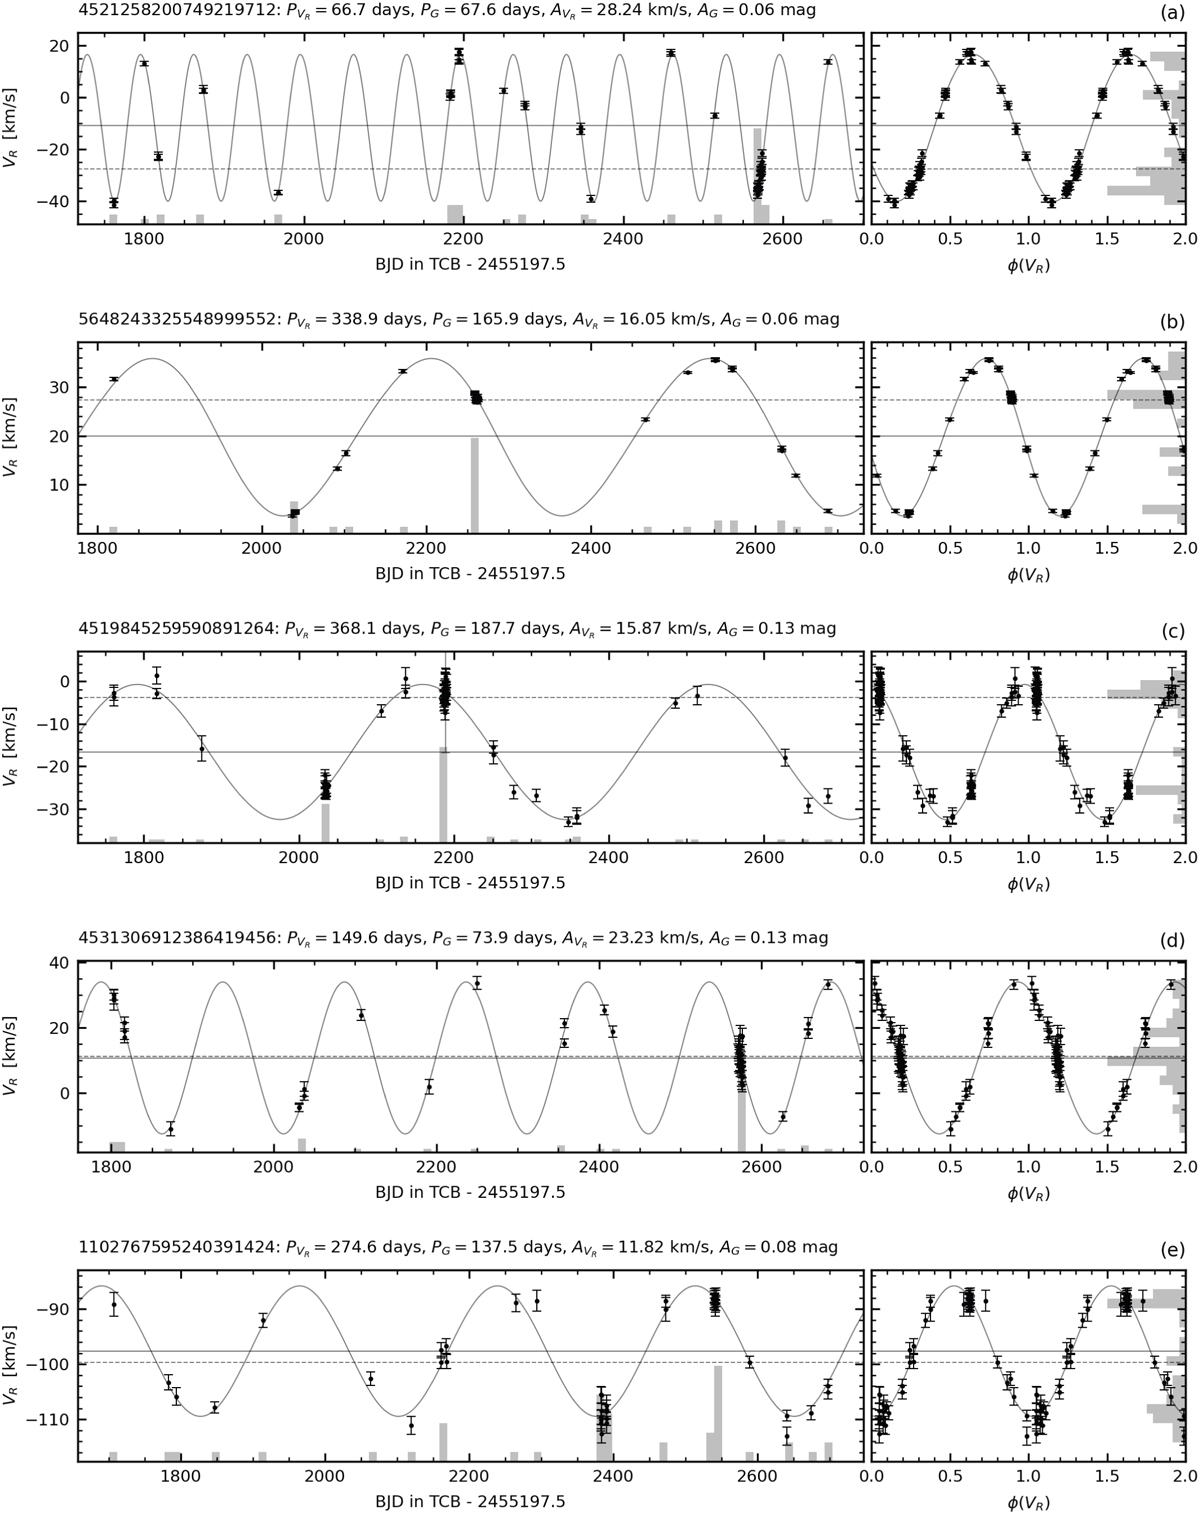
Similar to Fig. B.1, but showing examples of time series dominated by a large group of RV epochs spanning an interval of time much shorter than the typical period of the source, thereby distorting the time series statistics and causing a large difference between (VR) and ![]() . Cases (d) and (e) show examples where the clustered data points are, by chance, either located near the mid-point of the RV time series (case d), or cancel out with each other (case e).
. Cases (d) and (e) show examples where the clustered data points are, by chance, either located near the mid-point of the RV time series (case d), or cancel out with each other (case e).
Current usage metrics show cumulative count of Article Views (full-text article views including HTML views, PDF and ePub downloads, according to the available data) and Abstracts Views on Vision4Press platform.
Data correspond to usage on the plateform after 2015. The current usage metrics is available 48-96 hours after online publication and is updated daily on week days.
Initial download of the metrics may take a while.