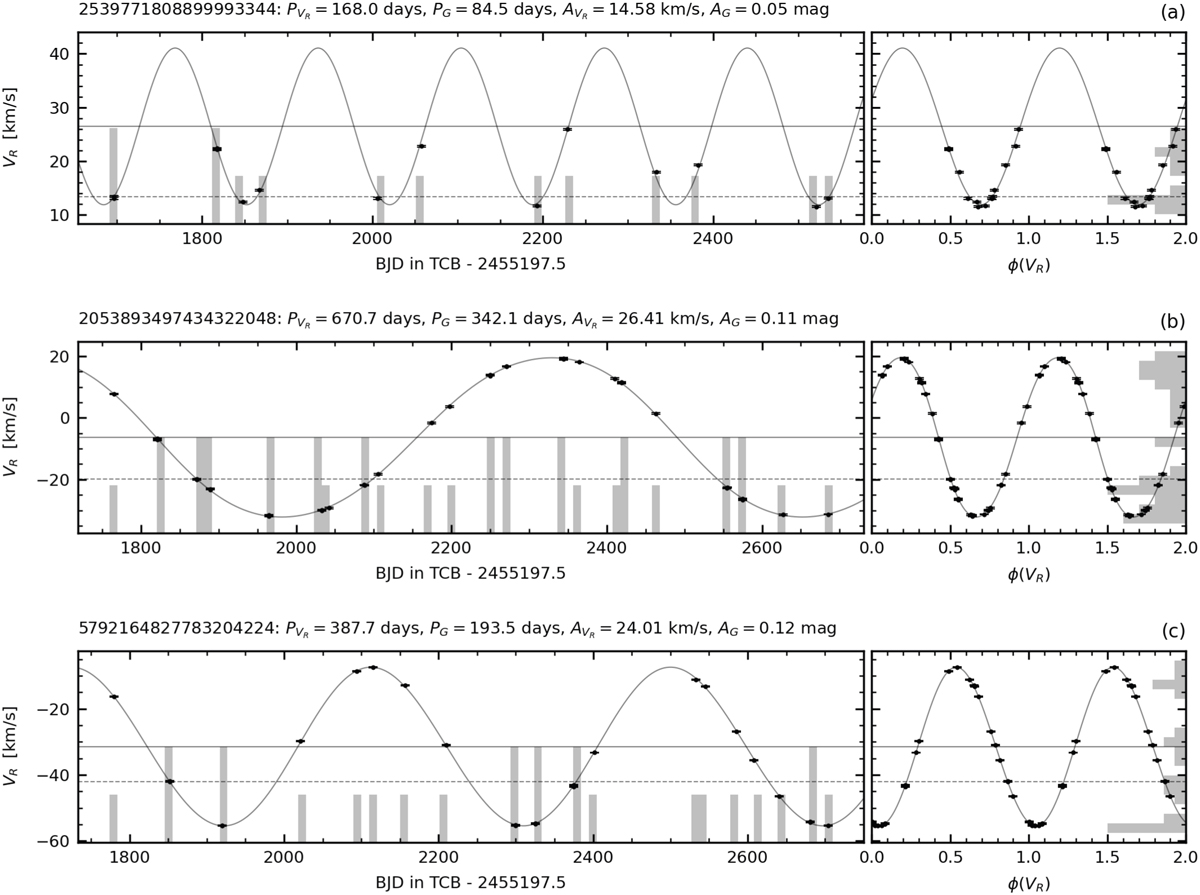
Fig. B.1
Download original image
Examples of RV time series in which only a small number of cycles is covered, and the minimum phase is oversampled compared to other phases, leading the median RV to underestimate the systemic RV. In each row, the left panel shows the RV time series and best-fit model, whereas their folded counterparts are displayed in the right panel. Histograms in both panels aid to visualize the distribution of measurements both in time (to identify clustered measurements) and in RV. The solid and dashed lines mark the values of the zero-point and median RVs, respectively.
Current usage metrics show cumulative count of Article Views (full-text article views including HTML views, PDF and ePub downloads, according to the available data) and Abstracts Views on Vision4Press platform.
Data correspond to usage on the plateform after 2015. The current usage metrics is available 48-96 hours after online publication and is updated daily on week days.
Initial download of the metrics may take a while.