Fig. A.1
Download original image
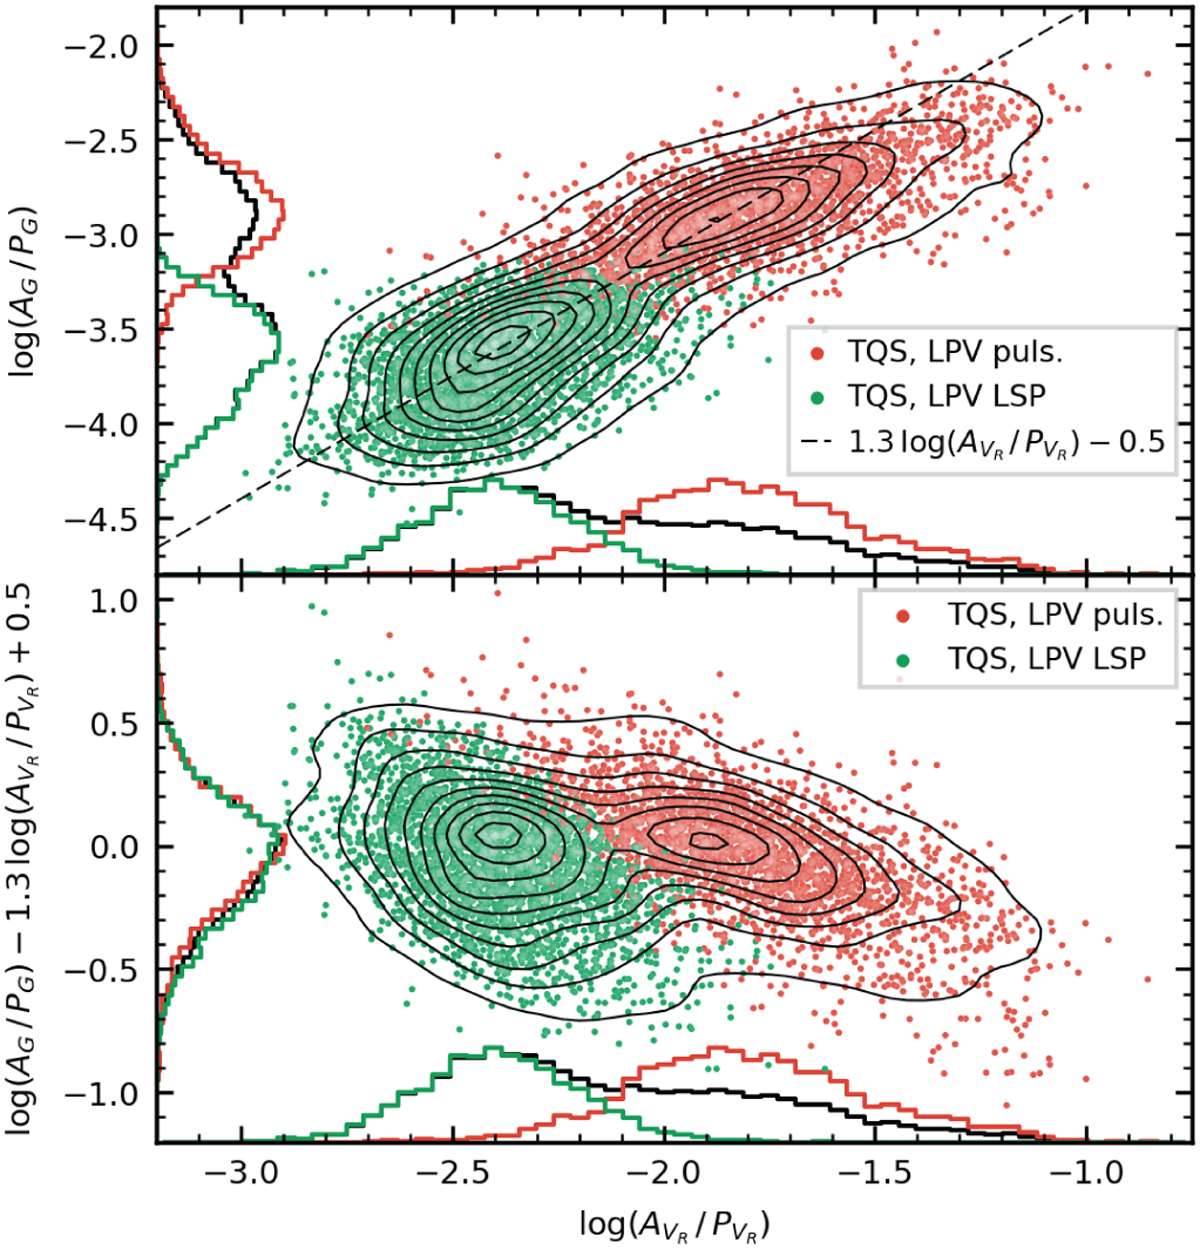
G-band versus RV period-amplitude ratios for the TQS sources classified as LPVs. Black contour lines represent a smoothed density map of the sample, and correspond to the black histograms on the sides of each panel. Each source is color-coded according to whether its period is identified as resulting from pulsation (red) or as an LSP (green). The same color-code is used for the histograms on the sides (normalized to their maximum). In the bottom panel the quantity log(AG/PG) is replaced with its distance from the dashed line displayed in the top panel, taken as an arbitrary reference.
Current usage metrics show cumulative count of Article Views (full-text article views including HTML views, PDF and ePub downloads, according to the available data) and Abstracts Views on Vision4Press platform.
Data correspond to usage on the plateform after 2015. The current usage metrics is available 48-96 hours after online publication and is updated daily on week days.
Initial download of the metrics may take a while.