Fig. 32
Download original image
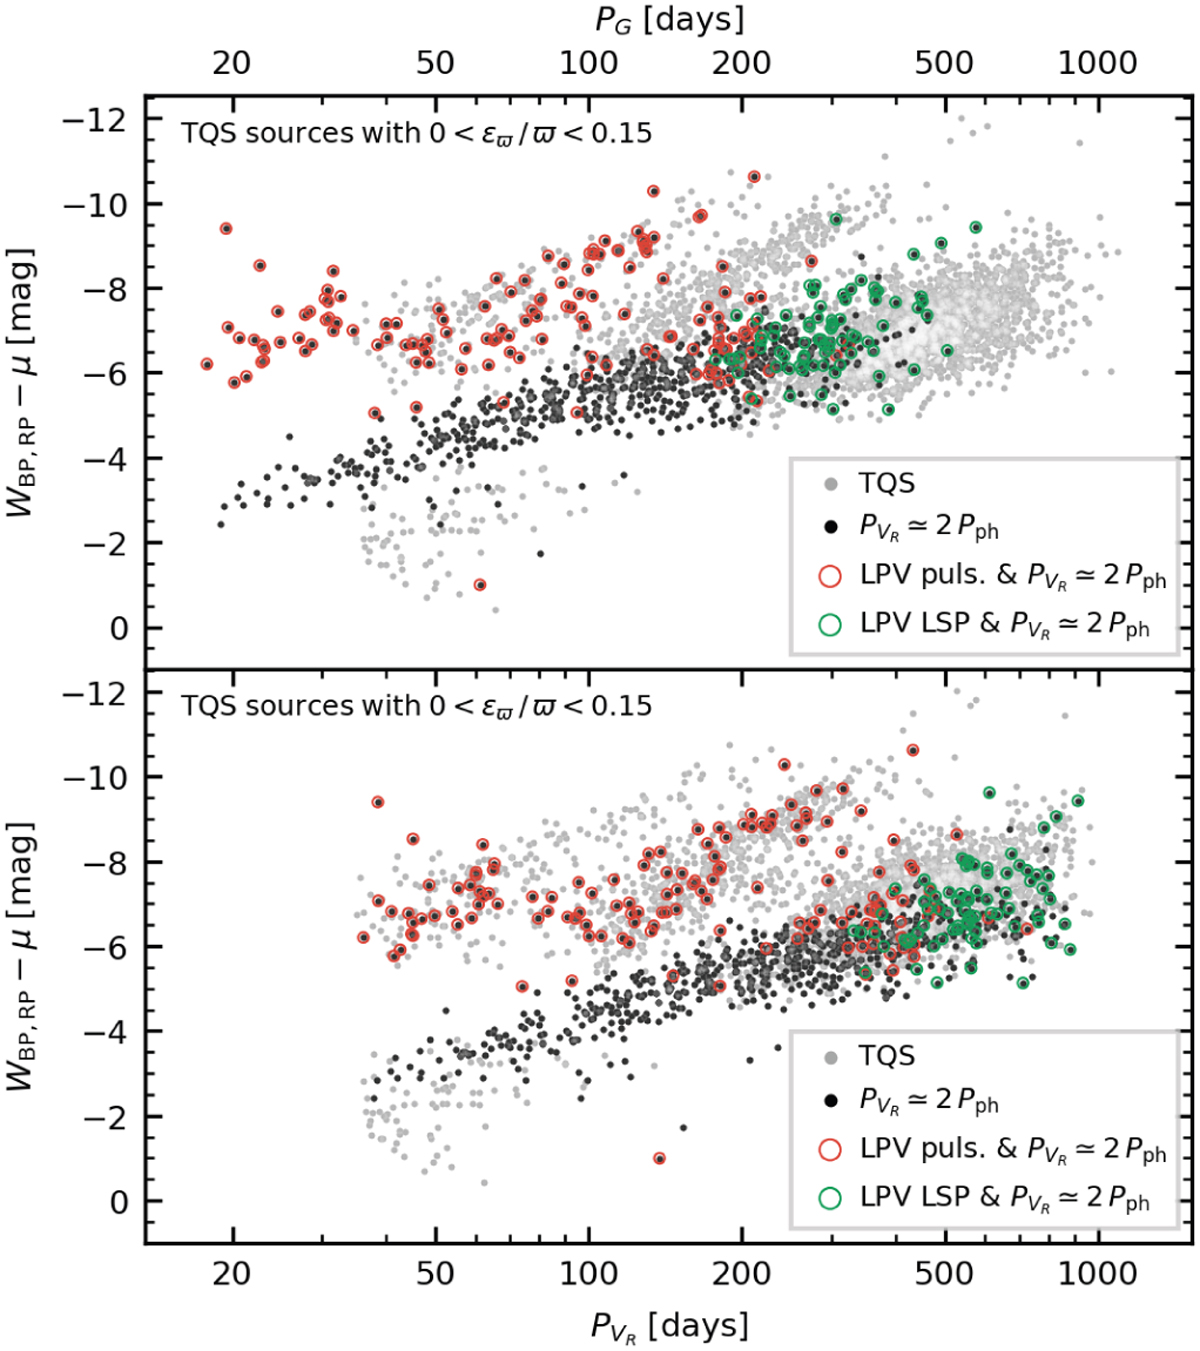
Similar to the right-hand side panels in Fig. 30, but with the sources having ![]() highlighted in black. The PLD constructed with PG is shown in the top panel and the one constructed with
highlighted in black. The PLD constructed with PG is shown in the top panel and the one constructed with ![]() in the bottom panel for the TQS sources with parallax errors better than 15% (gray symbols), and highlighting the sources with
in the bottom panel for the TQS sources with parallax errors better than 15% (gray symbols), and highlighting the sources with ![]() . Red and green circles indicate LPVs showing pulsation and a LSP, respectively. Only five of them are identified as C-rich.
. Red and green circles indicate LPVs showing pulsation and a LSP, respectively. Only five of them are identified as C-rich.
Current usage metrics show cumulative count of Article Views (full-text article views including HTML views, PDF and ePub downloads, according to the available data) and Abstracts Views on Vision4Press platform.
Data correspond to usage on the plateform after 2015. The current usage metrics is available 48-96 hours after online publication and is updated daily on week days.
Initial download of the metrics may take a while.