Open Access
Fig. 3
Download original image
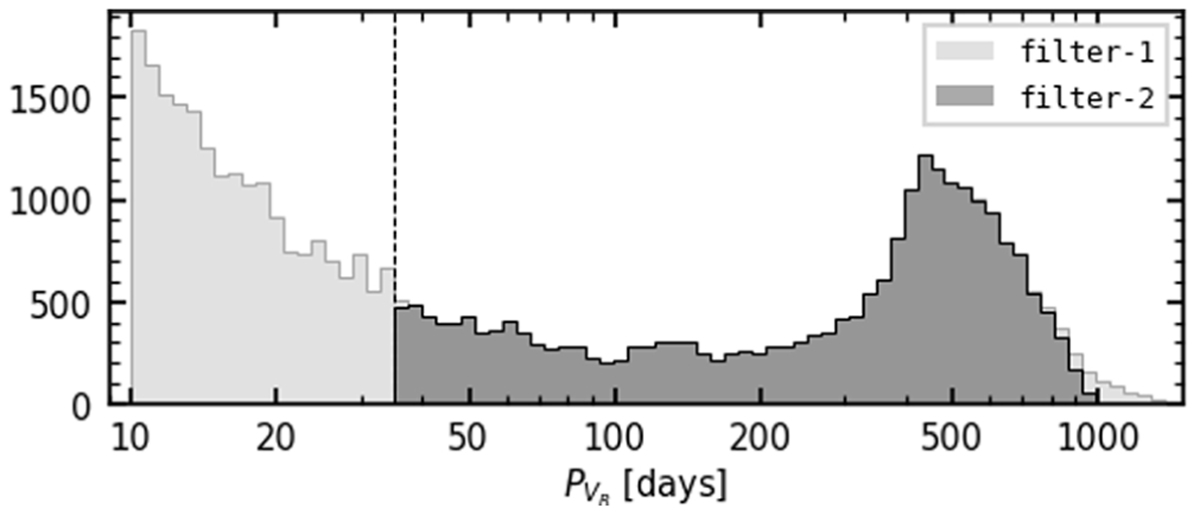
Distribution of the RV periods of the sample after applying the post-filtering conditions filter-1 (gray histogram, see Table 1) and after applying the conditions on the periods themselves (filter-2, black histogram). The vertical dashed line indicates the lower period limit at 35 days.
Current usage metrics show cumulative count of Article Views (full-text article views including HTML views, PDF and ePub downloads, according to the available data) and Abstracts Views on Vision4Press platform.
Data correspond to usage on the plateform after 2015. The current usage metrics is available 48-96 hours after online publication and is updated daily on week days.
Initial download of the metrics may take a while.