Fig. 28
Download original image
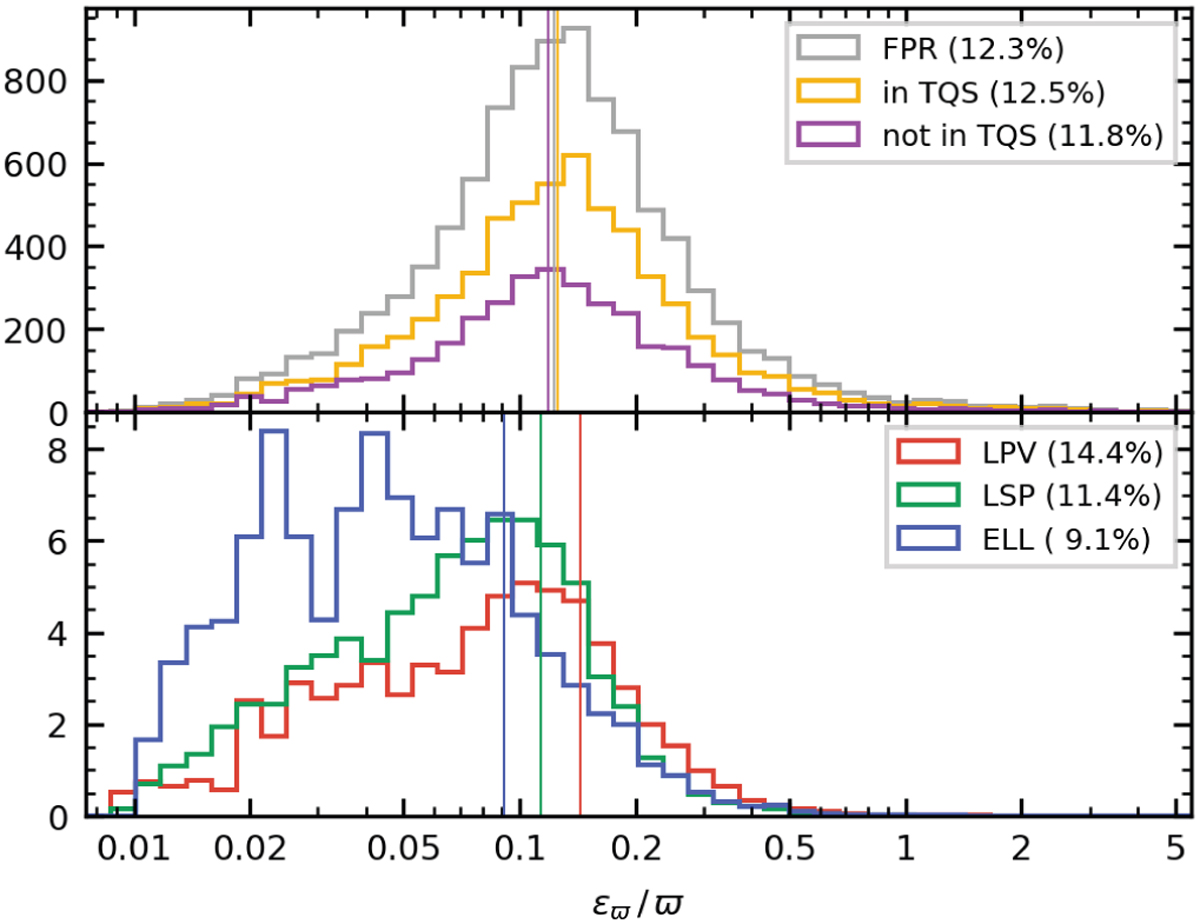
Distribution of relative parallax errors in the FPR, excluding 92 sources with negative parallaxes. In the top panel, the histograms represent the full FPR (gray curve), the TQS (orange curve), and the sources that are not part of the TQS (purple). In the bottom panel, they indicate the sources identified as pulsating LPVs (red), LPVs showing a LSP (green), or ELL (blue). Note that the histograms in the bottom panel are normalized to their area. For each subset, the vertical line indicates the median relative error, which is reported as a percentage in the legends.
Current usage metrics show cumulative count of Article Views (full-text article views including HTML views, PDF and ePub downloads, according to the available data) and Abstracts Views on Vision4Press platform.
Data correspond to usage on the plateform after 2015. The current usage metrics is available 48-96 hours after online publication and is updated daily on week days.
Initial download of the metrics may take a while.