Fig. 25
Download original image
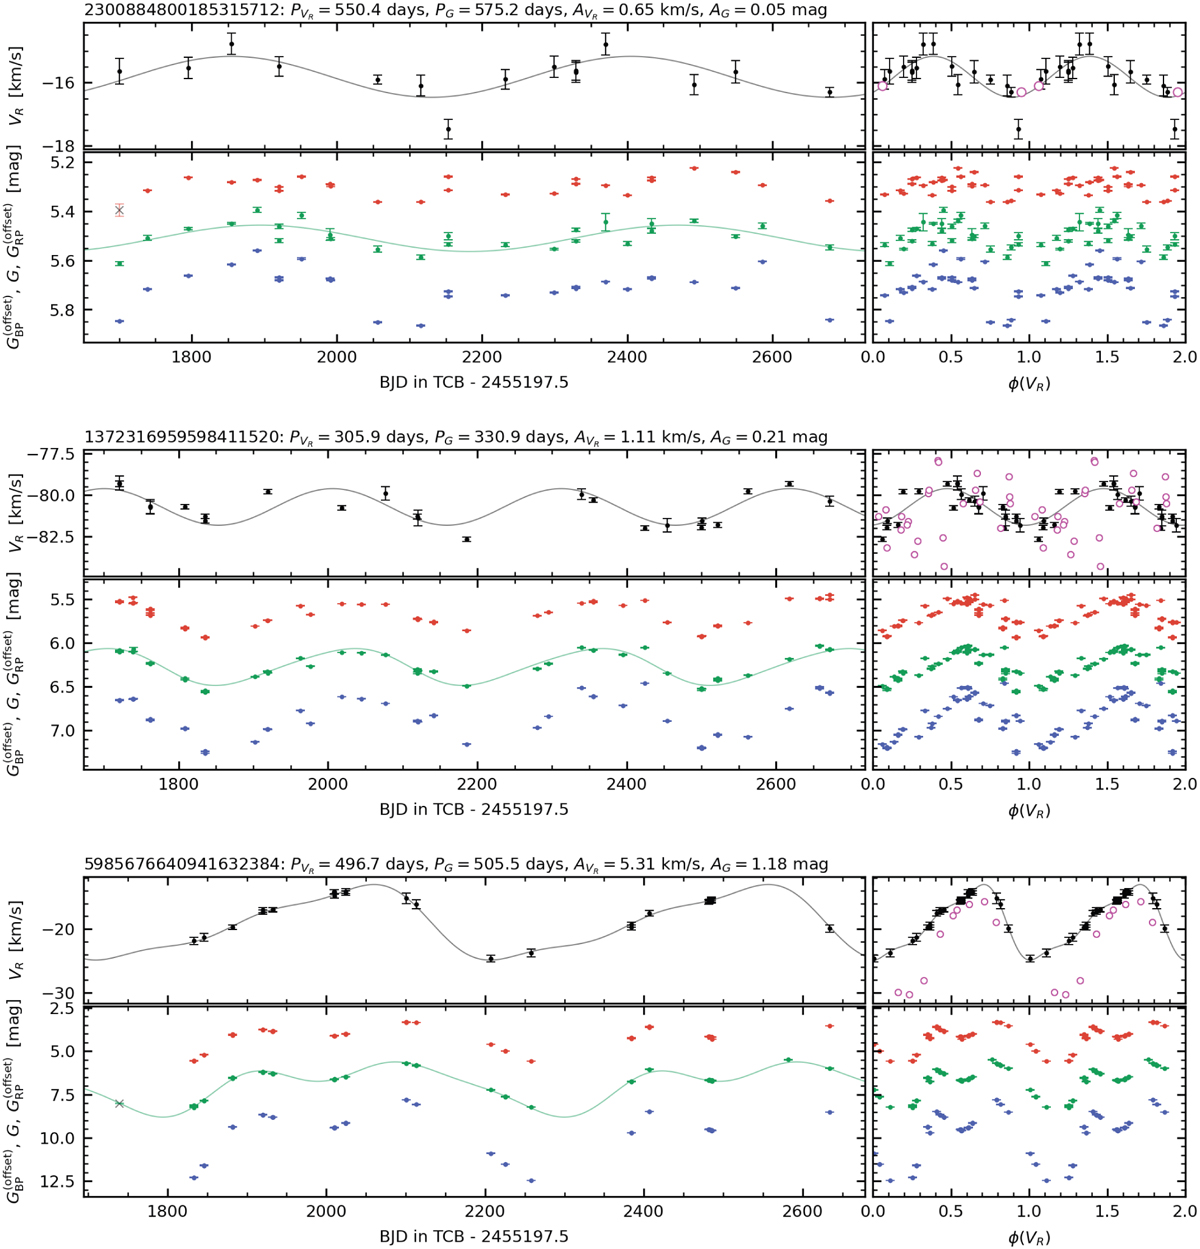
Similar to Fig. 9, but showing the Gaia time series for the sources compared with literature as discussed in Sect. 4.3.2 (see also Table 4). The sources displayed from top to bottom are the SRb star AR Cep (compared with Alvarez et al. 2001), the binary SRa star RS CrB (compared with Hinkle et al. 2002), and the O-rich Mira R Nor (compared with Lebzelter et al. 2005a). Literature RV time series are displayed as magenta circles (with arbitrary phase offset) in the panels showing the folded RV curve. In each case, the Gaia RV period (indicated in the header of each panel) is used for folding.
Current usage metrics show cumulative count of Article Views (full-text article views including HTML views, PDF and ePub downloads, according to the available data) and Abstracts Views on Vision4Press platform.
Data correspond to usage on the plateform after 2015. The current usage metrics is available 48-96 hours after online publication and is updated daily on week days.
Initial download of the metrics may take a while.