Open Access
Fig. 24
Download original image
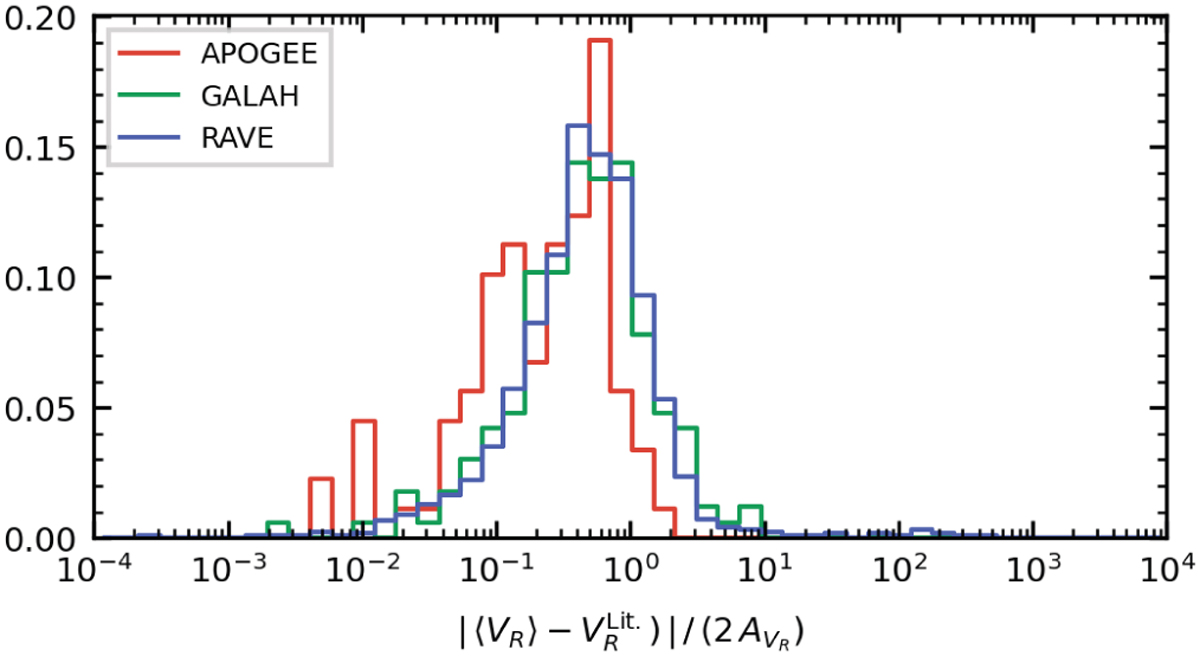
Comparison between the median RV from this FPR with the average values provided by external catalogs (red: APOGEE; green: GALAH; blue: RAVE). We consider the absolute difference between the two values, normalized to the peak-to-peak model amplitude. We note that the histograms are normalized to their area.
Current usage metrics show cumulative count of Article Views (full-text article views including HTML views, PDF and ePub downloads, according to the available data) and Abstracts Views on Vision4Press platform.
Data correspond to usage on the plateform after 2015. The current usage metrics is available 48-96 hours after online publication and is updated daily on week days.
Initial download of the metrics may take a while.