Fig. 2
Download original image
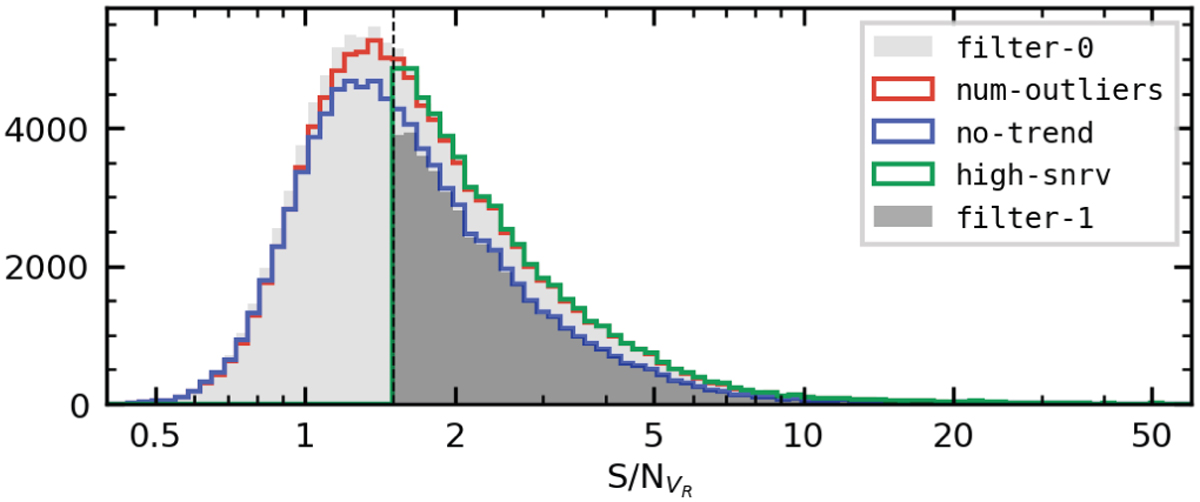
Distribution of the RV signal-to-noise ratio, ![]() , for the pre-filtered sample (gray histogram) and with the conditions involved in the filter-1 post-filtering step, labeled num-outliers (red curve), no-trend (blue curve), and high-snrv (green curve) and described in Table 1. The dark gray histogram shows the combination of the three conditions. The vertical dashed line indicates the
, for the pre-filtered sample (gray histogram) and with the conditions involved in the filter-1 post-filtering step, labeled num-outliers (red curve), no-trend (blue curve), and high-snrv (green curve) and described in Table 1. The dark gray histogram shows the combination of the three conditions. The vertical dashed line indicates the ![]() threshold.
threshold.
Current usage metrics show cumulative count of Article Views (full-text article views including HTML views, PDF and ePub downloads, according to the available data) and Abstracts Views on Vision4Press platform.
Data correspond to usage on the plateform after 2015. The current usage metrics is available 48-96 hours after online publication and is updated daily on week days.
Initial download of the metrics may take a while.