Fig. 19
Download original image
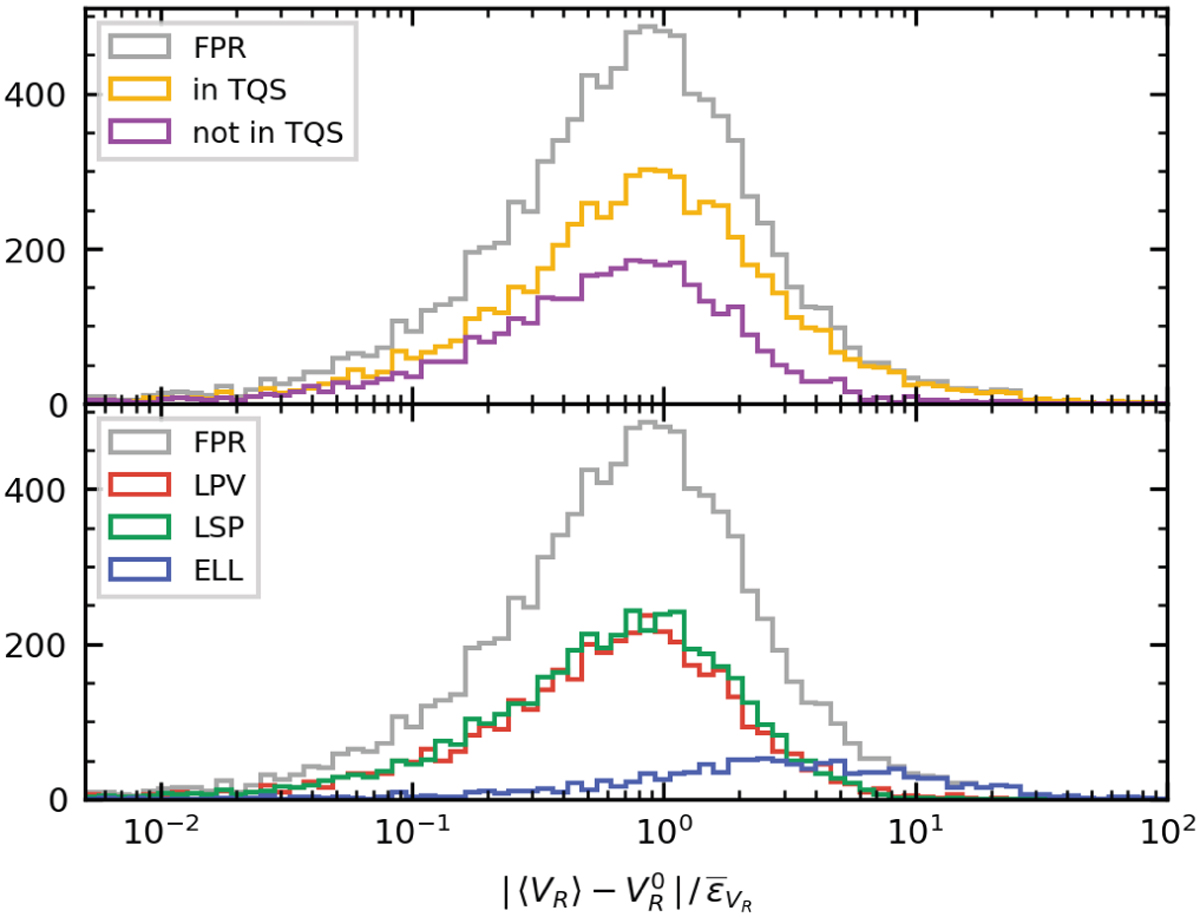
Absolute difference between 〈VR〉 and ![]() , scaled by the mean of epoch RV uncertainties, for various subsets of the FPR sample. In the top panel, the orange curve corresponds to sources flagged for high consistency between RV and photometric periods, whereas all other sources are represented by the purple curve. In the bottom panel, the red, green and blue curve correspond to sources tentatively identified as pulsating LPVs, LPVs showing LSP variability, or ellipsoidal variables, respectively (see Sect. 3). The gray curves in both panels represent the whole FPR sample.
, scaled by the mean of epoch RV uncertainties, for various subsets of the FPR sample. In the top panel, the orange curve corresponds to sources flagged for high consistency between RV and photometric periods, whereas all other sources are represented by the purple curve. In the bottom panel, the red, green and blue curve correspond to sources tentatively identified as pulsating LPVs, LPVs showing LSP variability, or ellipsoidal variables, respectively (see Sect. 3). The gray curves in both panels represent the whole FPR sample.
Current usage metrics show cumulative count of Article Views (full-text article views including HTML views, PDF and ePub downloads, according to the available data) and Abstracts Views on Vision4Press platform.
Data correspond to usage on the plateform after 2015. The current usage metrics is available 48-96 hours after online publication and is updated daily on week days.
Initial download of the metrics may take a while.