Open Access
Fig. 18
Download original image
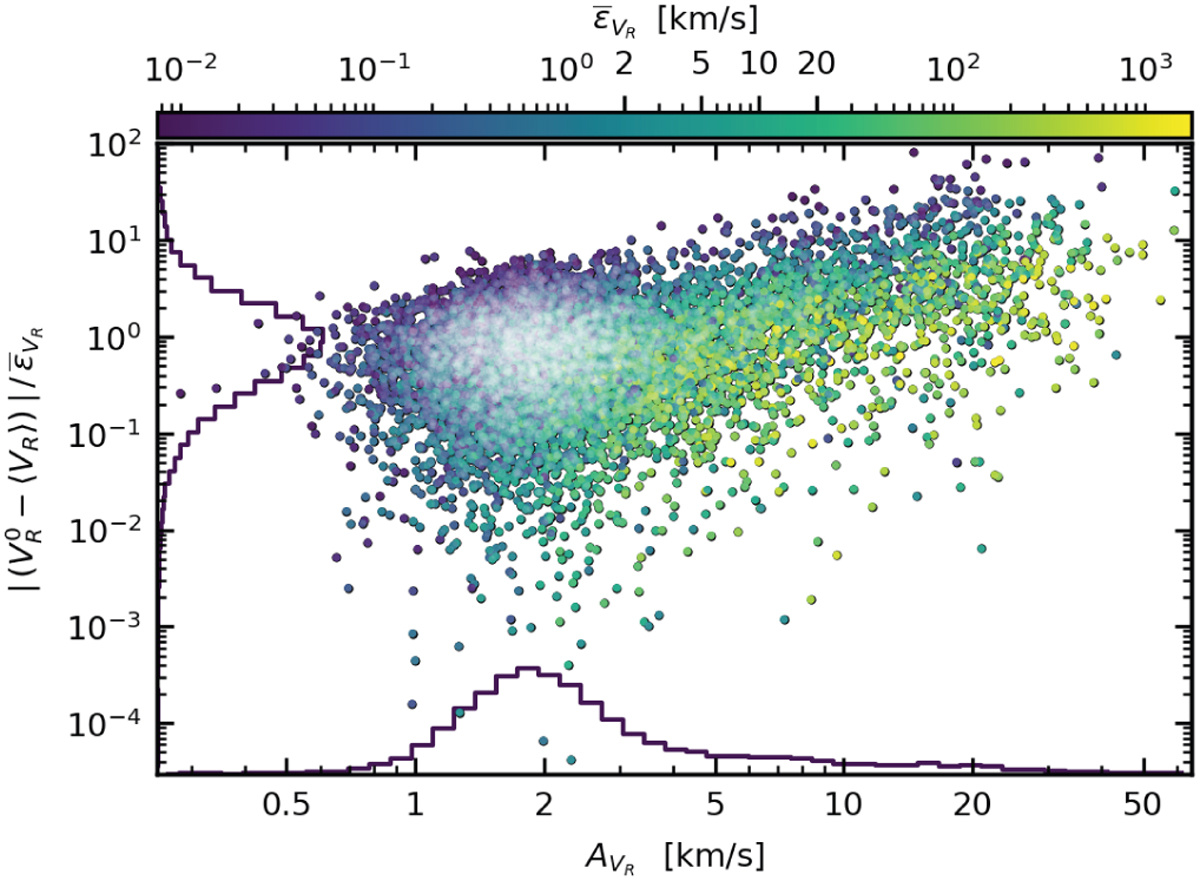
Absolute difference between the median value 〈VR〉 and the zero point ![]() RV estimates, scaled to the mean value of the uncertainties on individual RV epochs, and shown against the semi-amplitude
RV estimates, scaled to the mean value of the uncertainties on individual RV epochs, and shown against the semi-amplitude ![]() of the RV time series model. A white shading indicates a more densely populated area of the diagram.
of the RV time series model. A white shading indicates a more densely populated area of the diagram.
Current usage metrics show cumulative count of Article Views (full-text article views including HTML views, PDF and ePub downloads, according to the available data) and Abstracts Views on Vision4Press platform.
Data correspond to usage on the plateform after 2015. The current usage metrics is available 48-96 hours after online publication and is updated daily on week days.
Initial download of the metrics may take a while.