Fig. 17
Download original image
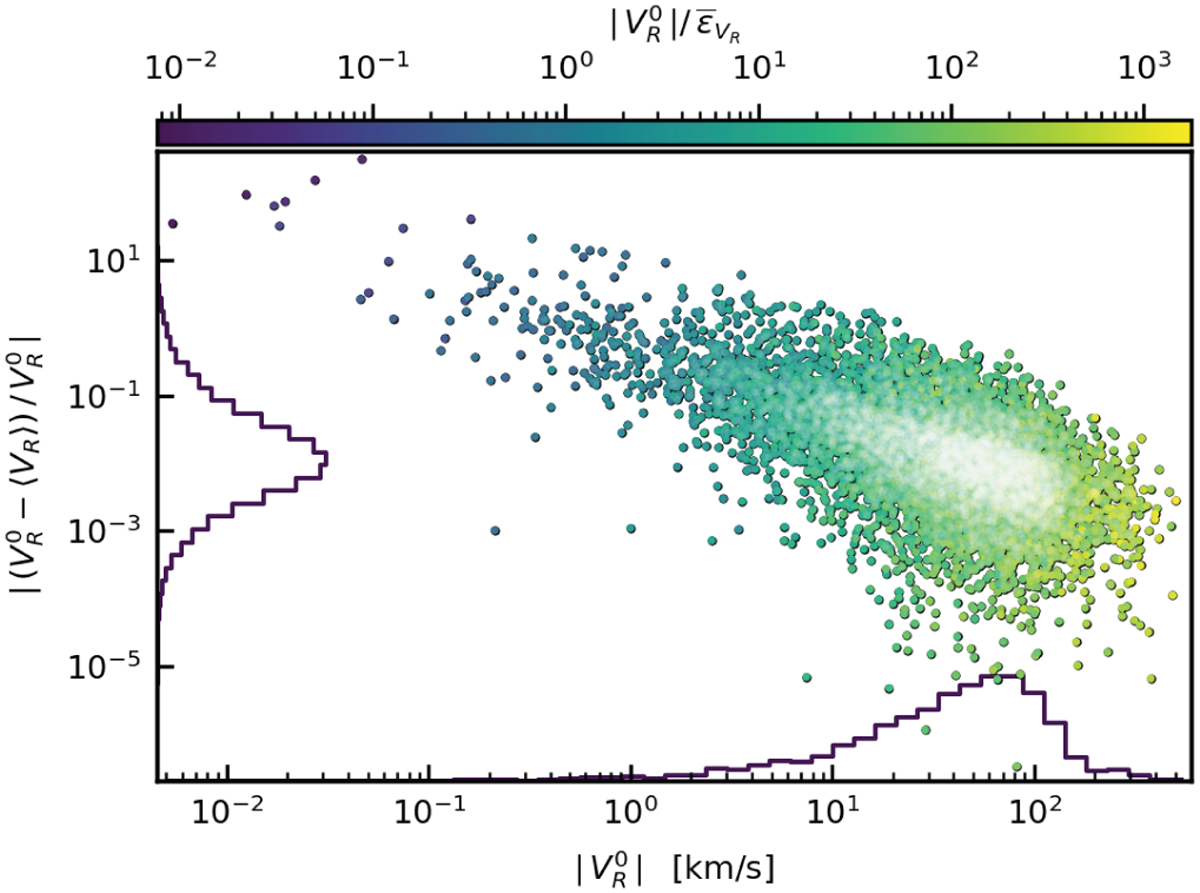
Absolute difference between the median value 〈VR〉 and the zero point ![]() RV estimates, scaled to the latter and shown against the absolute value
RV estimates, scaled to the latter and shown against the absolute value ![]() of the latter. Data points are color-coded by the ratio
of the latter. Data points are color-coded by the ratio ![]() , showing that large discrepancies (top portion of the diagram) are associated with absolute values of the systemic RV comparable with or smaller than the RV uncertainty. A white shading indicates a more densely populated area of the diagram.
, showing that large discrepancies (top portion of the diagram) are associated with absolute values of the systemic RV comparable with or smaller than the RV uncertainty. A white shading indicates a more densely populated area of the diagram.
Current usage metrics show cumulative count of Article Views (full-text article views including HTML views, PDF and ePub downloads, according to the available data) and Abstracts Views on Vision4Press platform.
Data correspond to usage on the plateform after 2015. The current usage metrics is available 48-96 hours after online publication and is updated daily on week days.
Initial download of the metrics may take a while.